Introduction
CharityEngine has a variety of reports to evaluate the success of your Opportunities. Our preconfigured reporting allows users to quickly and easily report on overall pipeline performance - or to narrow down performance across stages, priorities, tracks, solicitors, etc. There are a variety of options available to users to best manage and track their opportunities and moves management performance. All reports are also available in three views, including through a pivot table, a period over period comparison, as well as a summary. This article will focus on the Pipeline reporting - but explore other opportunity reports to identify areas of opportunity and optimize your moves management processes.
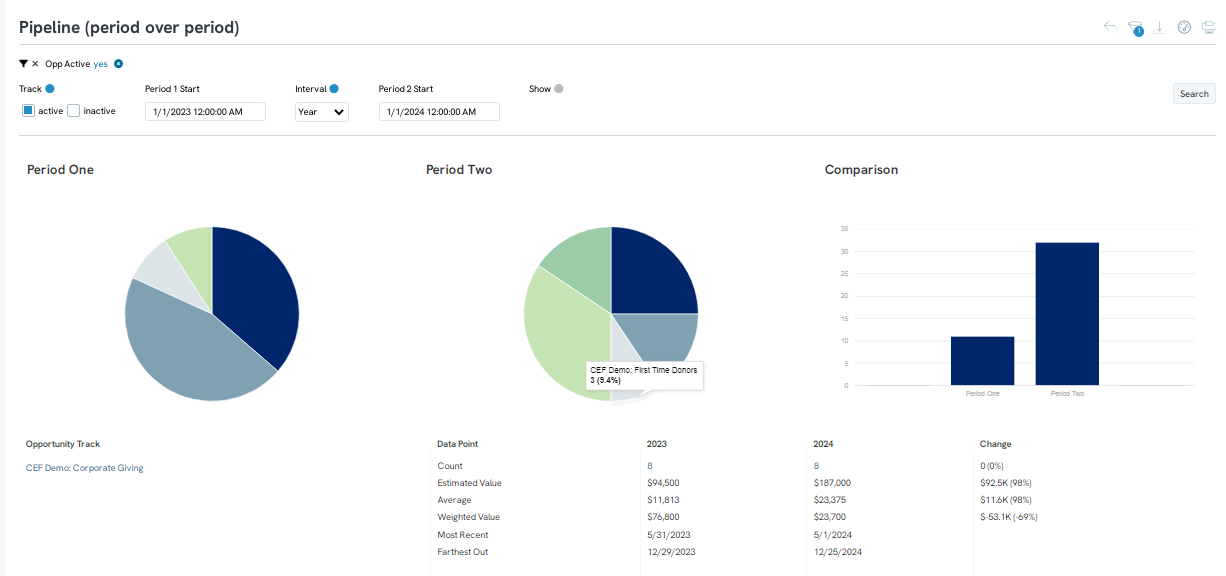
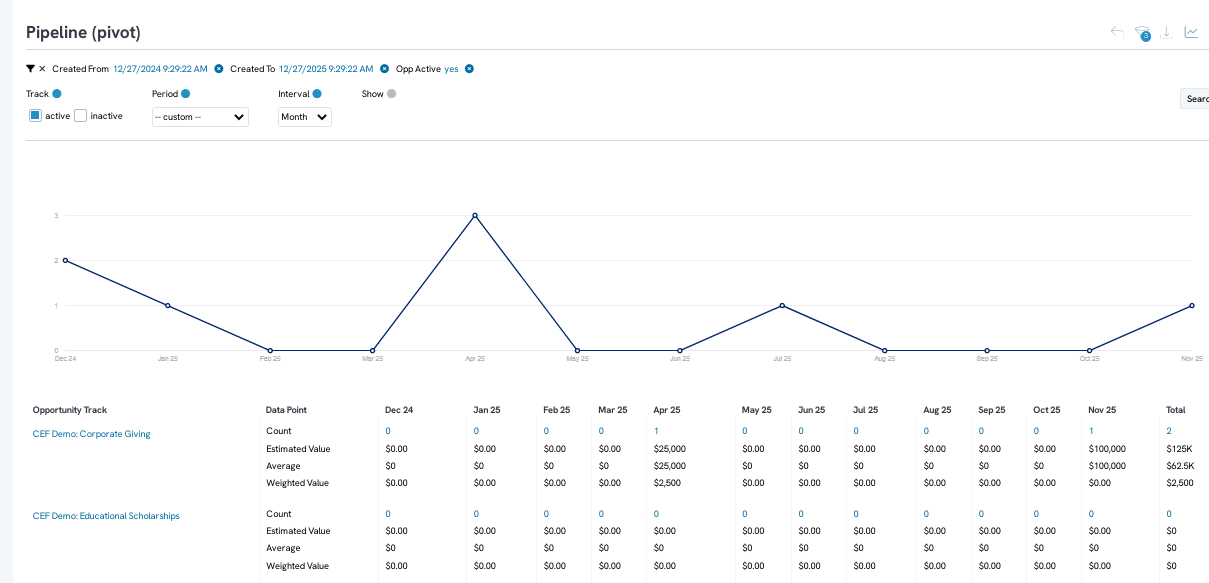
Table of Contents
- Introduction
- Prerequisites
- Instructions - Out of the Box Reporting of Reports & Analytics App:
- Pipeline Summary Report
- Pipeline (Pivot)
- Pipeline (period over period)
- Instructions: Opportunity Dashboard
- Return to: Opportunities & Moves Management: Comprehensive Guide for Set Up, Configuration, and Reporting
Prerequisites
- Existing opportunities should exist within your database to return data values
- Configuration of opportunities should be complete to maximize the reporting elements including elements such as weighted value and estimated value projections
Instructions - Out of the Box Reporting of Reports & Analytics App:
Step 1: To run an opportunities report, navigate to the Reports & Analytics App > Opportunities > select the report you wish to see.
-
- Under each header multiple reports will be available for Opportunities. In the example below, users can view the summary, pivot, and pop (period over period) reports.
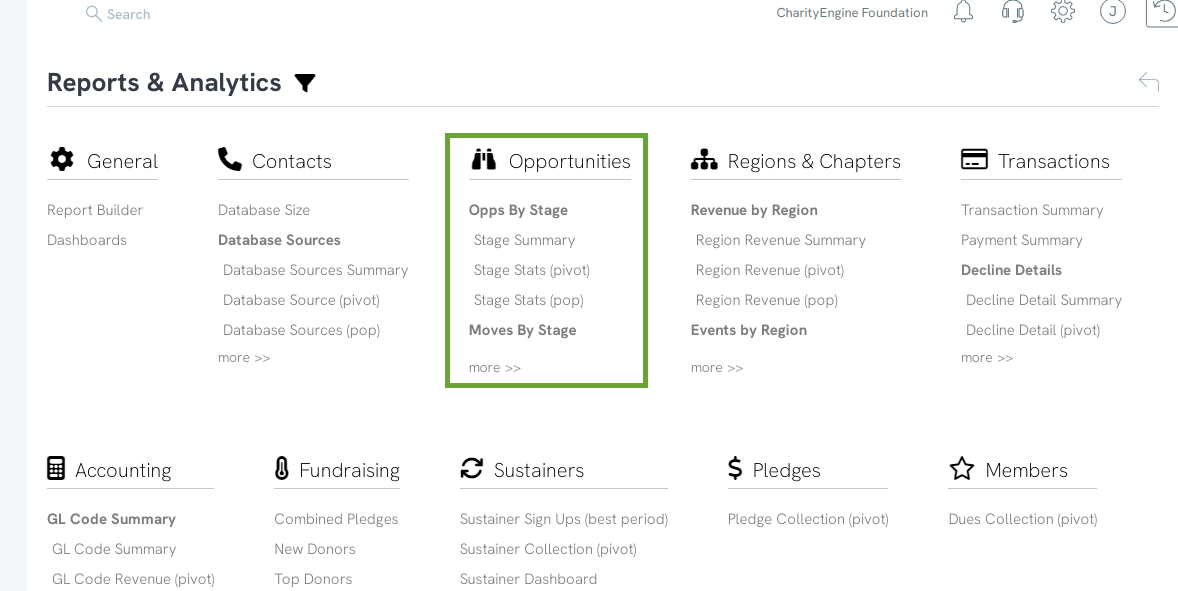
- Under each header multiple reports will be available for Opportunities. In the example below, users can view the summary, pivot, and pop (period over period) reports.
Pipeline Summary Report
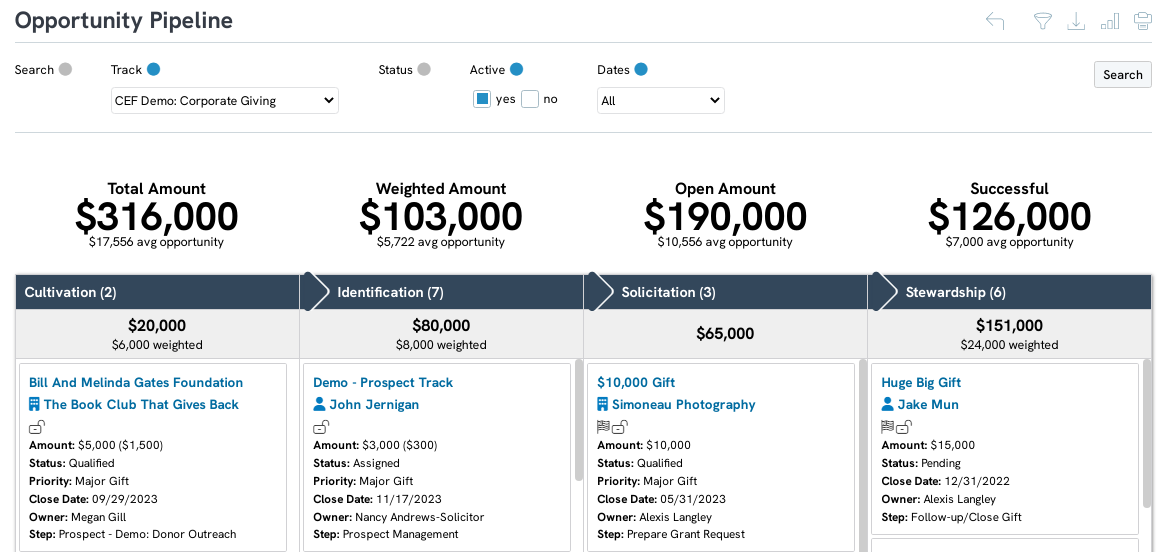
To view an overall summary of the stage, click on the Pipeline Summary report.
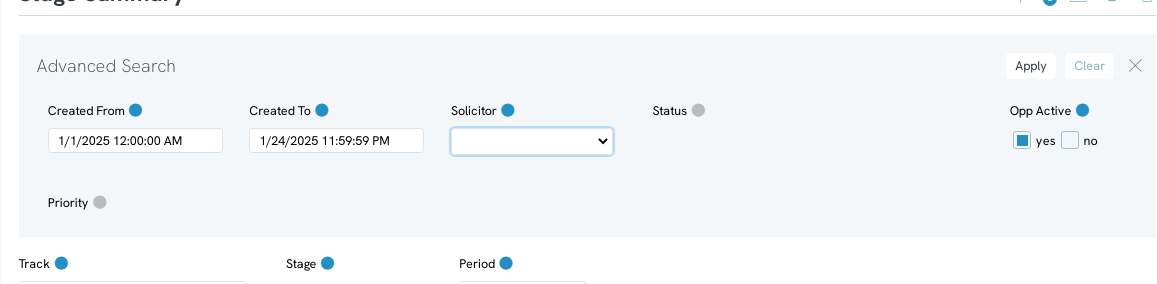
The pipeline summary page will allow you to see a high-level summary of opportunity track estimates. Use the filters to define time frames, and to narrow down by status. 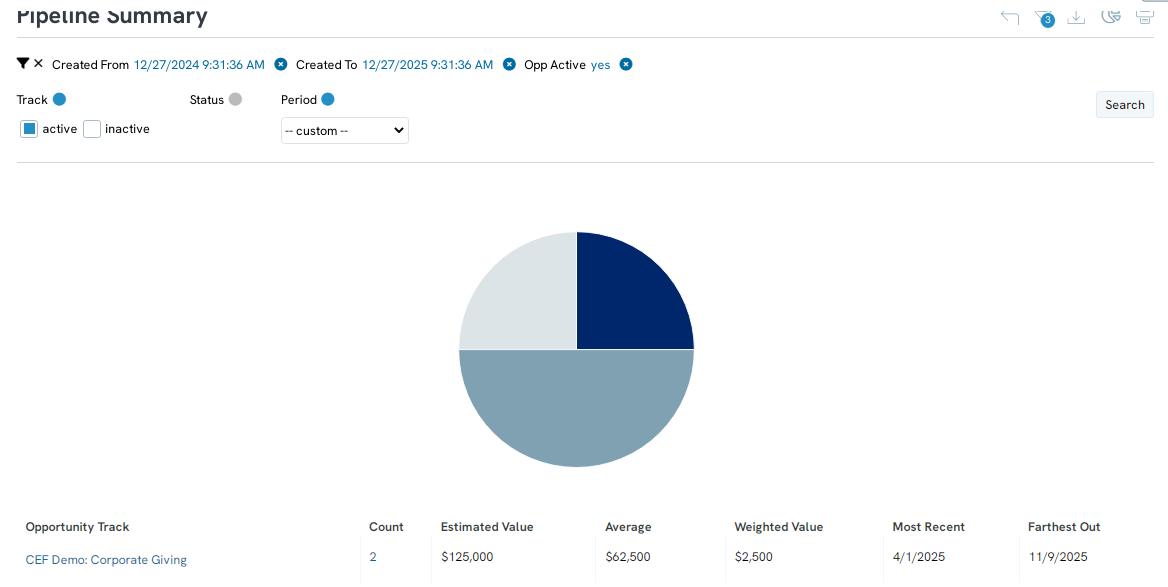
Note: the weighted value refers to the estimated value of the stage multiplied by the current stage close probability. These are established through Opportunity configuration.
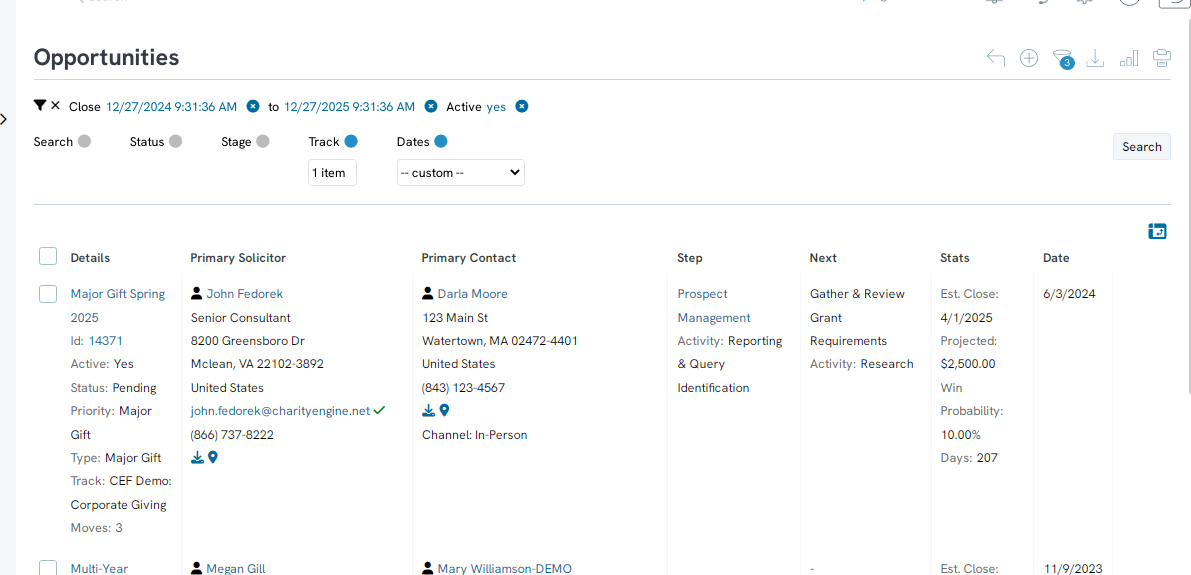
You can also click through to quickly access specific opportunity ids.
Pipeline (Pivot)
To view data regarding your overall pipeline, select the Pipeline (pivot)
Pipeline (period over period)
To view your opportunity pipeline data for comparison across two periods, select Pipeline (pop).
You will now be able to see the statistics of your opportunities by selecting the period time frames. Select when the first and second period started and the interval in which these periods are separated.
Note, select period 1 start and period 2 start - leverage the Interval drop down to modify time periods from hourly to yearly.

Instructions: Opportunity Dashboard
By accessing the People App > Opportunities > Pipeline, users can view summary and track progression.
Note: Proper configuration of opportunities is required.