Introduction
CharityEngine offers functionality to customize and create dashboards to assist your organization in tracking various elements across your database. This tool is a great way to create executive summaries, track performance, and to increase your ability to act on data. CharityEngine Dashboards allow you and your users with at-a-glance visibility, save time and resources, improve your decision making, provide easy performance checks and balances, and up-to-date progress evaluation.
Table of Contents
Prerequisites
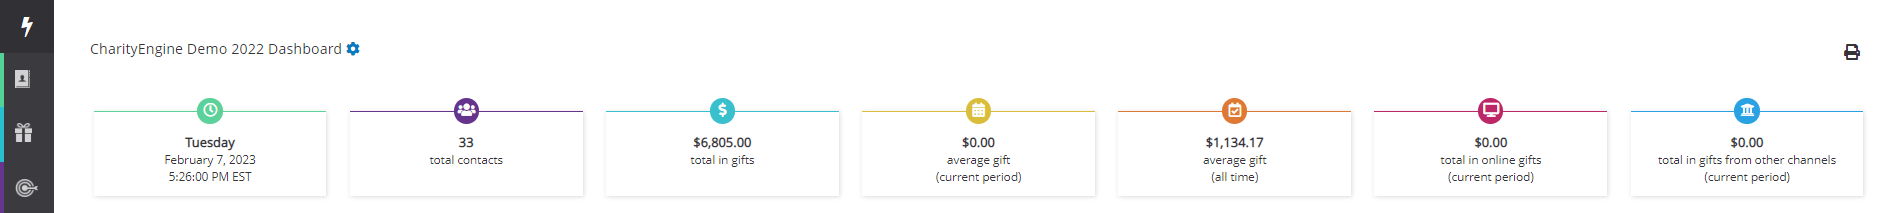
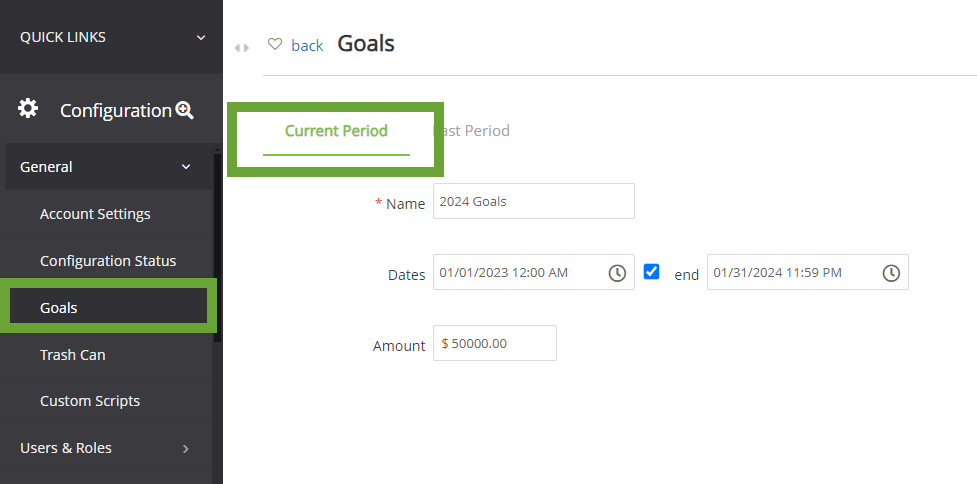
To use gift totals from the main, out of box, dashboard, the user will need to set Current Period Goals within the Configuration App.
This value can be set by accessing the Configuration App > General > Goals > Current Period
Creation of reports and queries will be used within the dashboard feature. You can also leverage pre-existing dashboard widgets located through the out-of-the-box reporting. To learn more about using our reporting elements please read:
Automation & Workflow: An Introduction to Queries
Overview
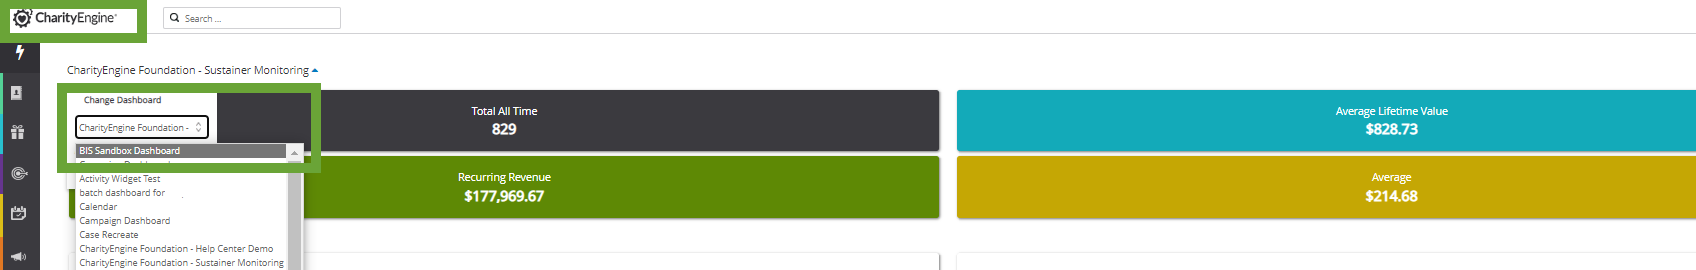
Your organization can access out-of-the-box and custom dashboards. The standard default will include a view of your organization's Dashboard. To change the dashboard view, navigate to the top right and click on the Widget icon to expose a drop down. Your out-of-the-box dashboards also include a Campaign dashboard. Any custom dashboards can also be accessed here.
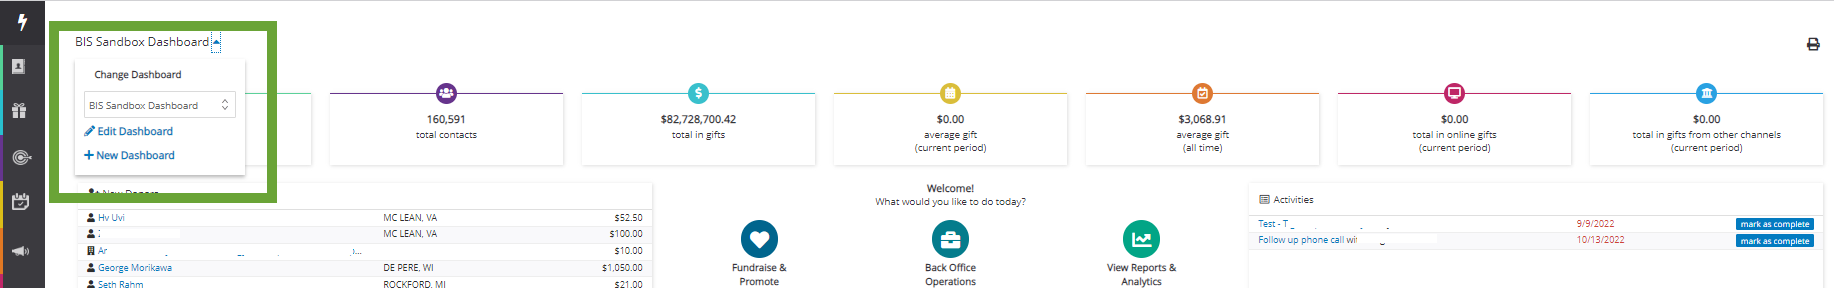
You can also Edit Dashboard or create a New Dashboard. These options are also available by navigating to the Reports & Analytics > General > Dashboards.
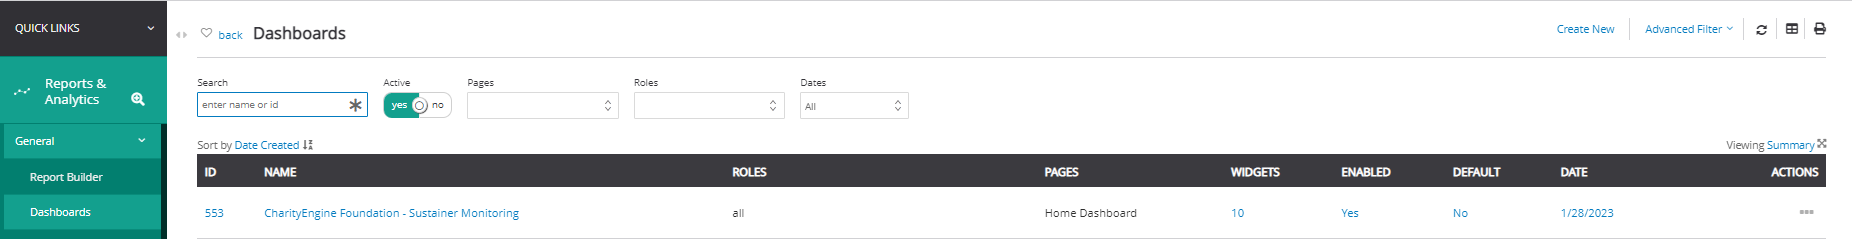
Instructions: Creating a Dashboard
To get started, please ensure you have created all available reporting through the report builder or query features.
Step 1: Navigate to the Reports & Analytics App > General > Dashboard > Create New.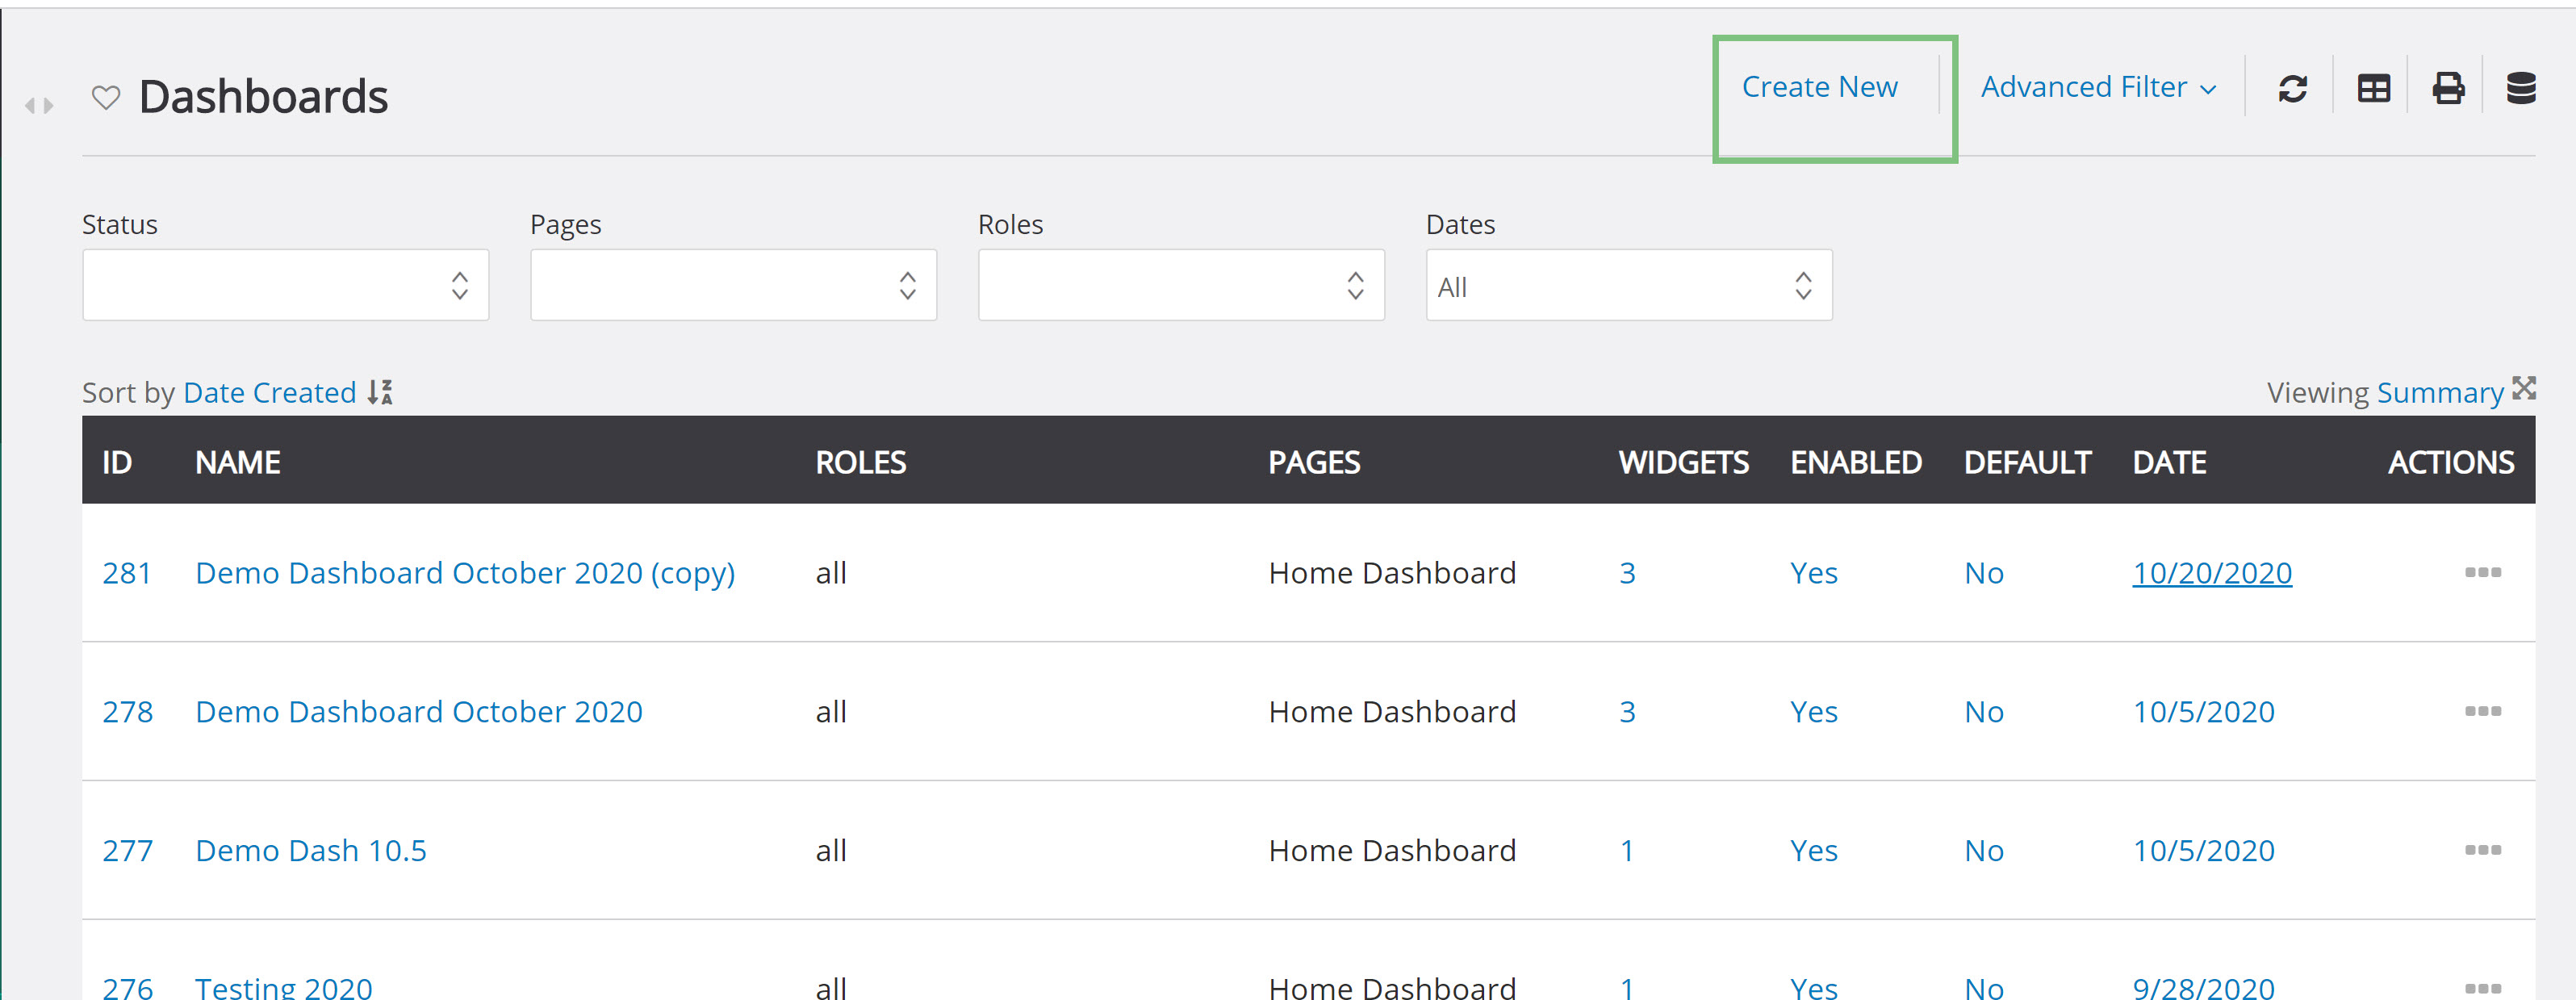
Step 2: On the General tab, create a Name (required) for the dashboard, determine if the dashboard should be the default and primary view when users log in, if all user roles can access the dashboard, and the Default Period of time for your dashboard elements. Click SAVE to expose additional configuration options.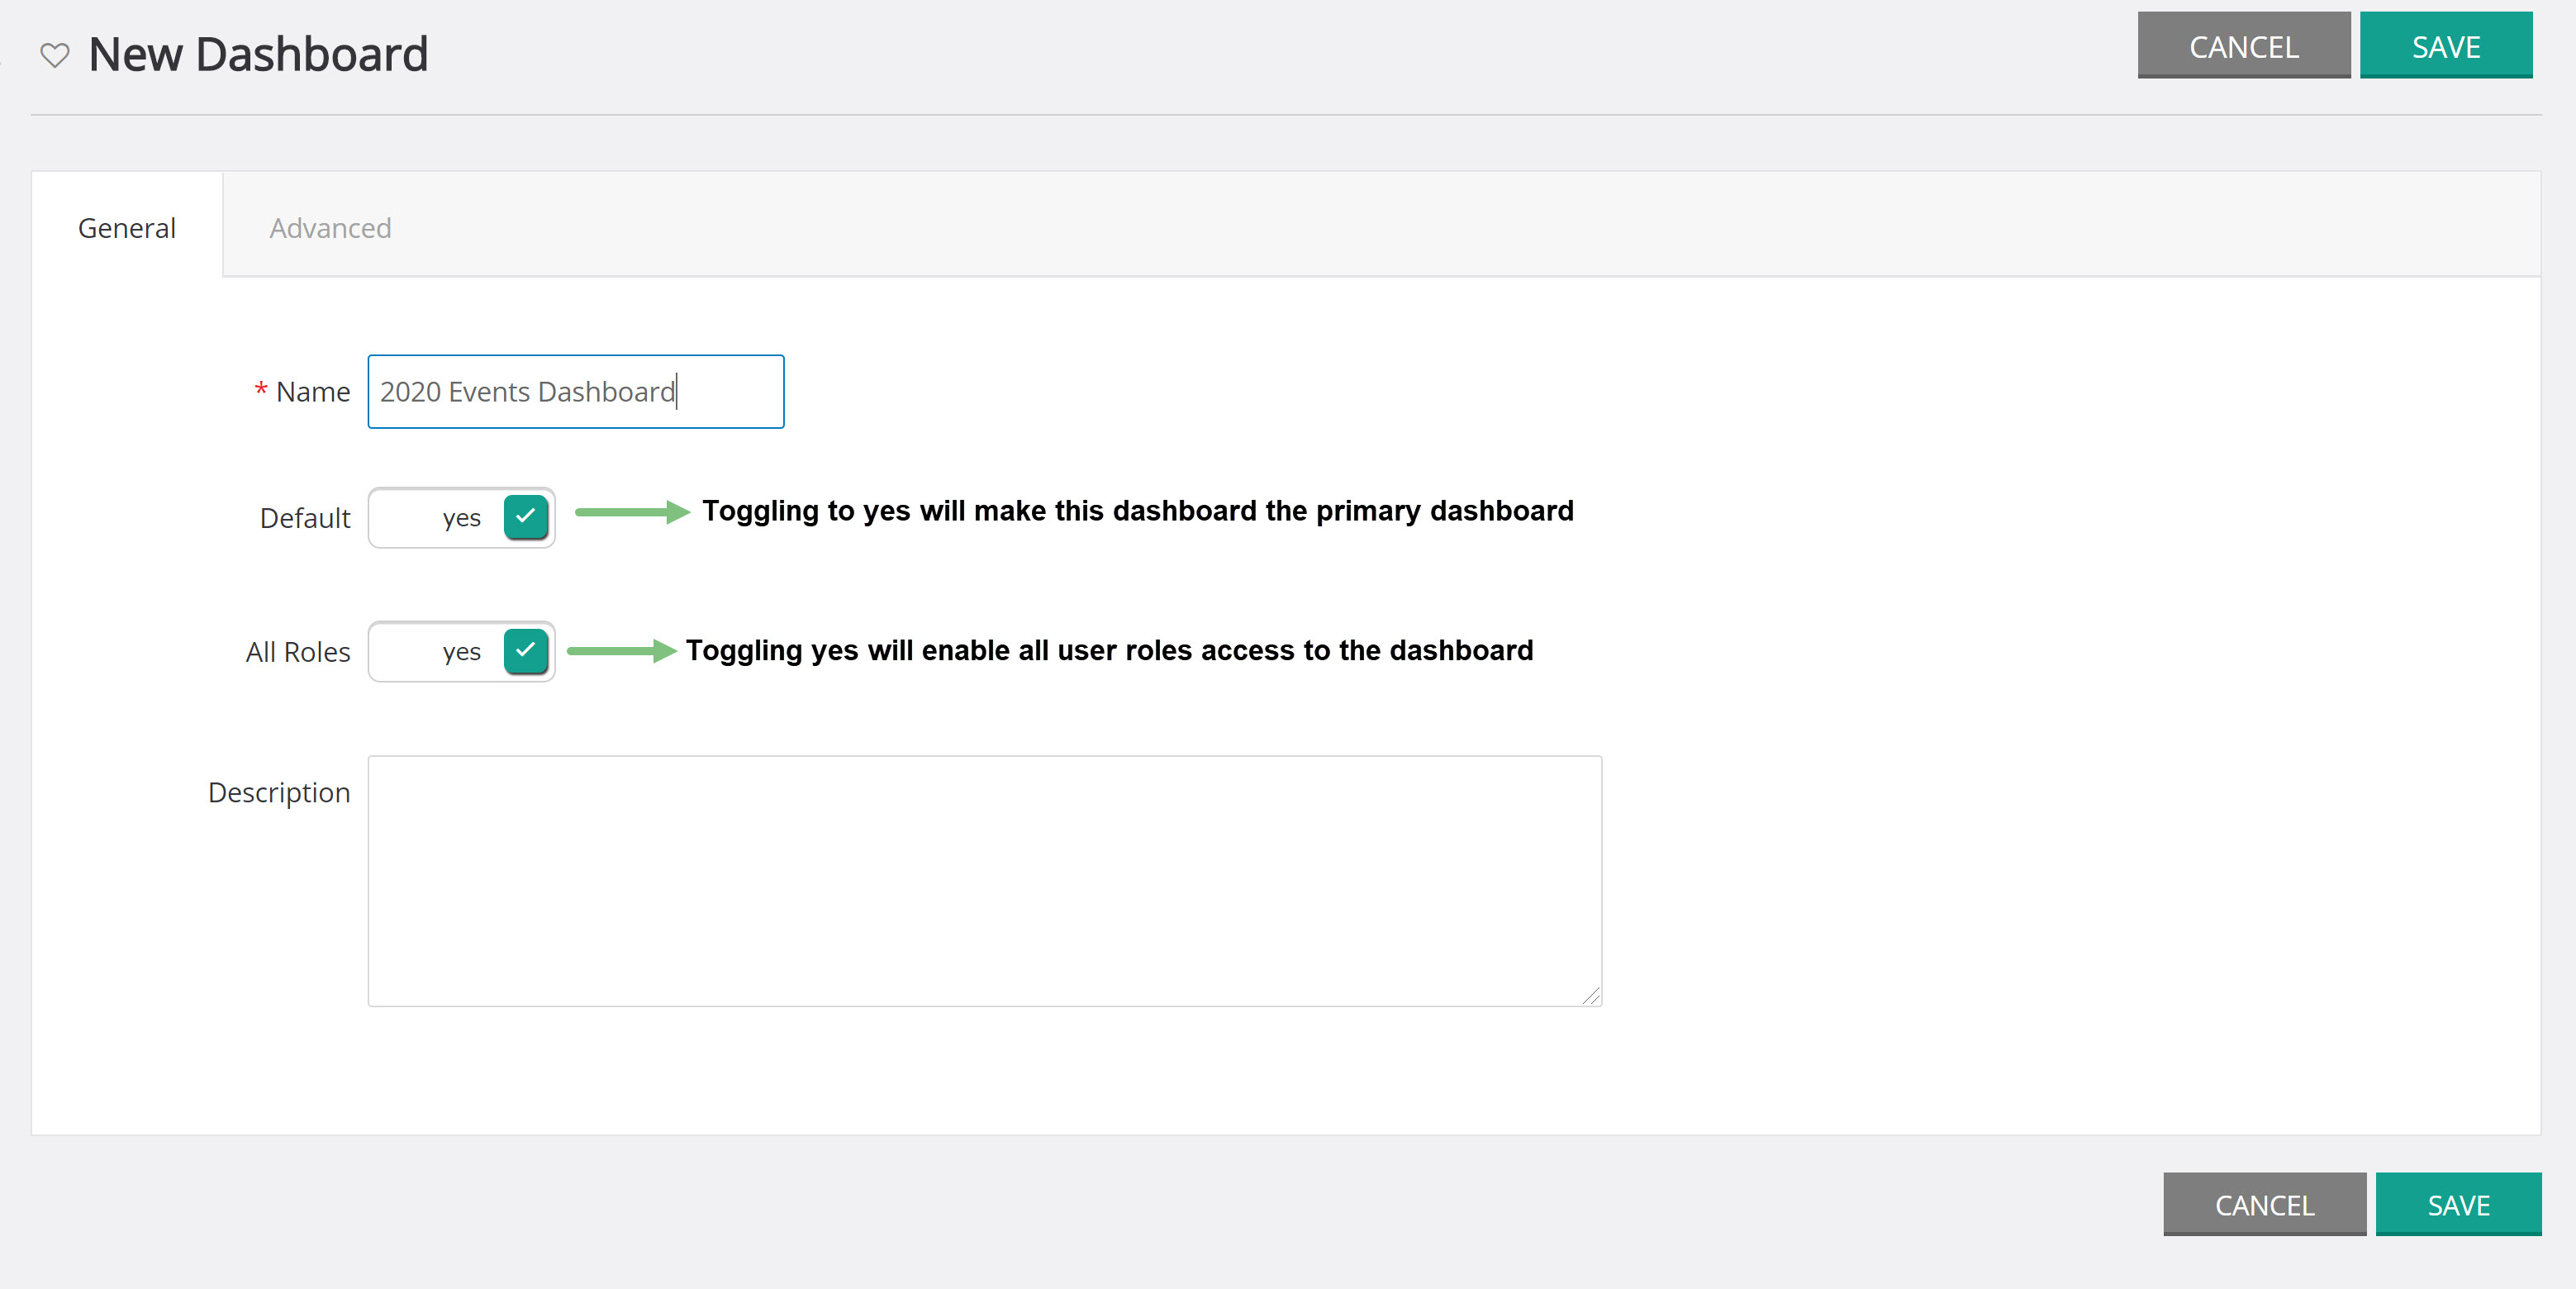
Step 3: Once you click SAVE, the Roles and Pages tabs will appear for further configurations. On the Roles tab, select from the dropdown what type of user will be able to access this dashboard and click Add.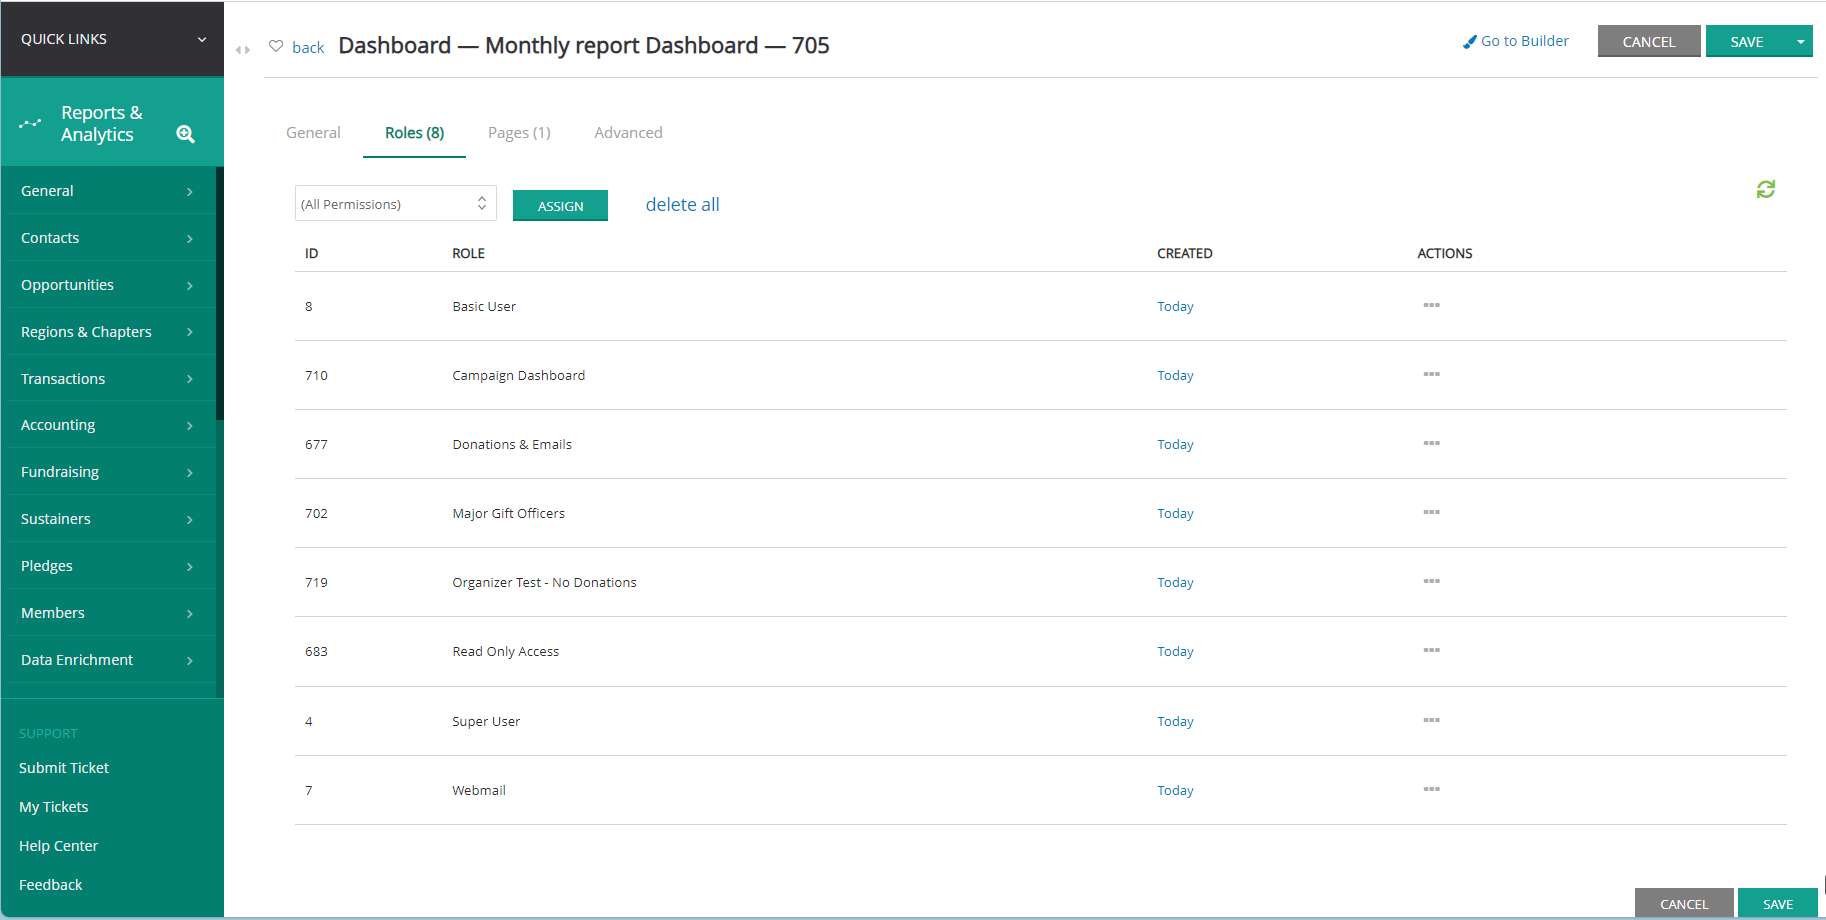
Step 4: Once added the role type will be displayed below and other types of roles can be added.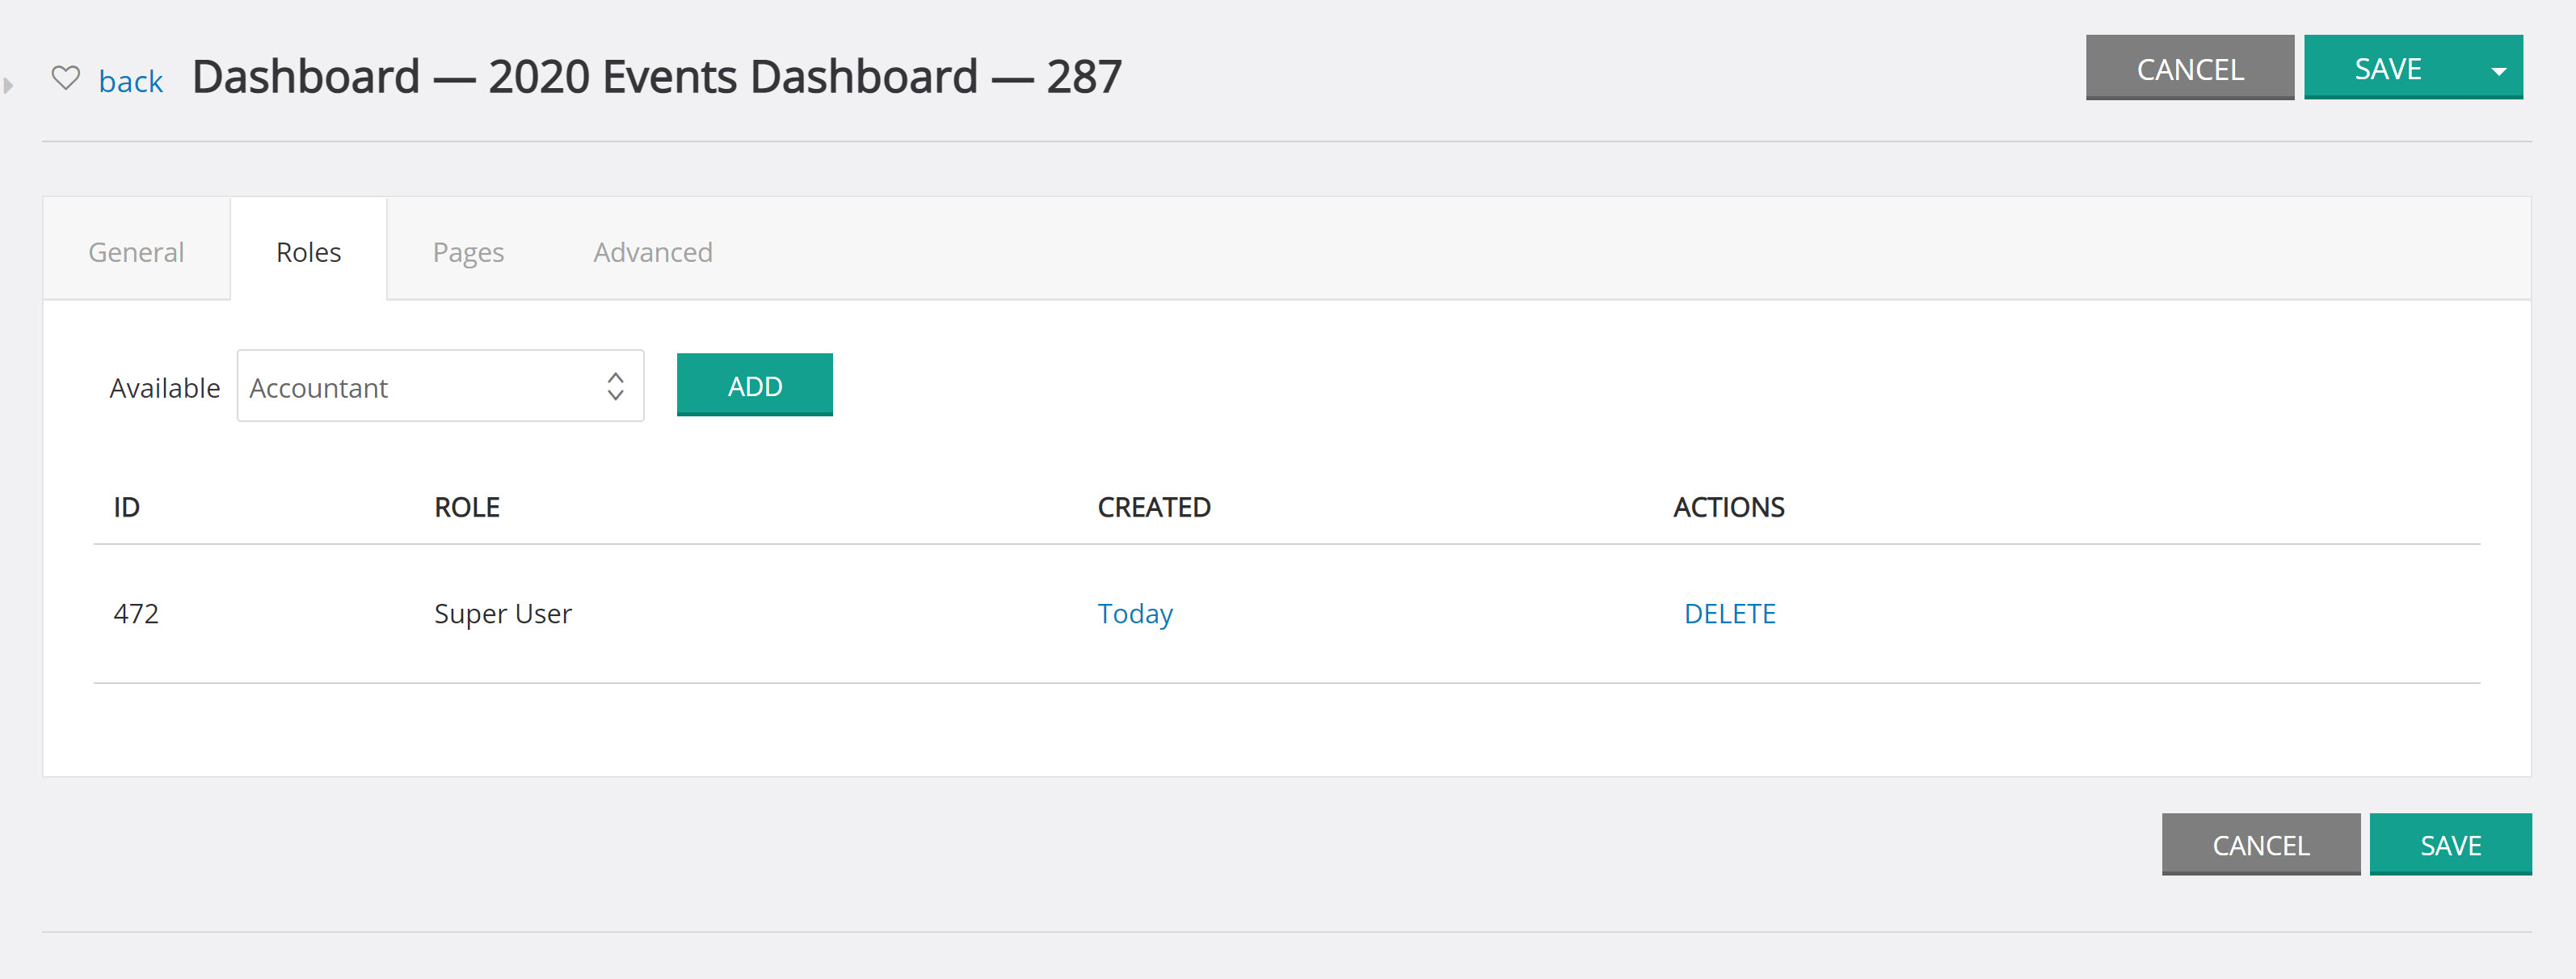
Step 5: On the Pages tab, use the dropdown to select what pages in CharityEngine the dashboard will be available on. Adding Organizations & People will add the dashboard to the Contact App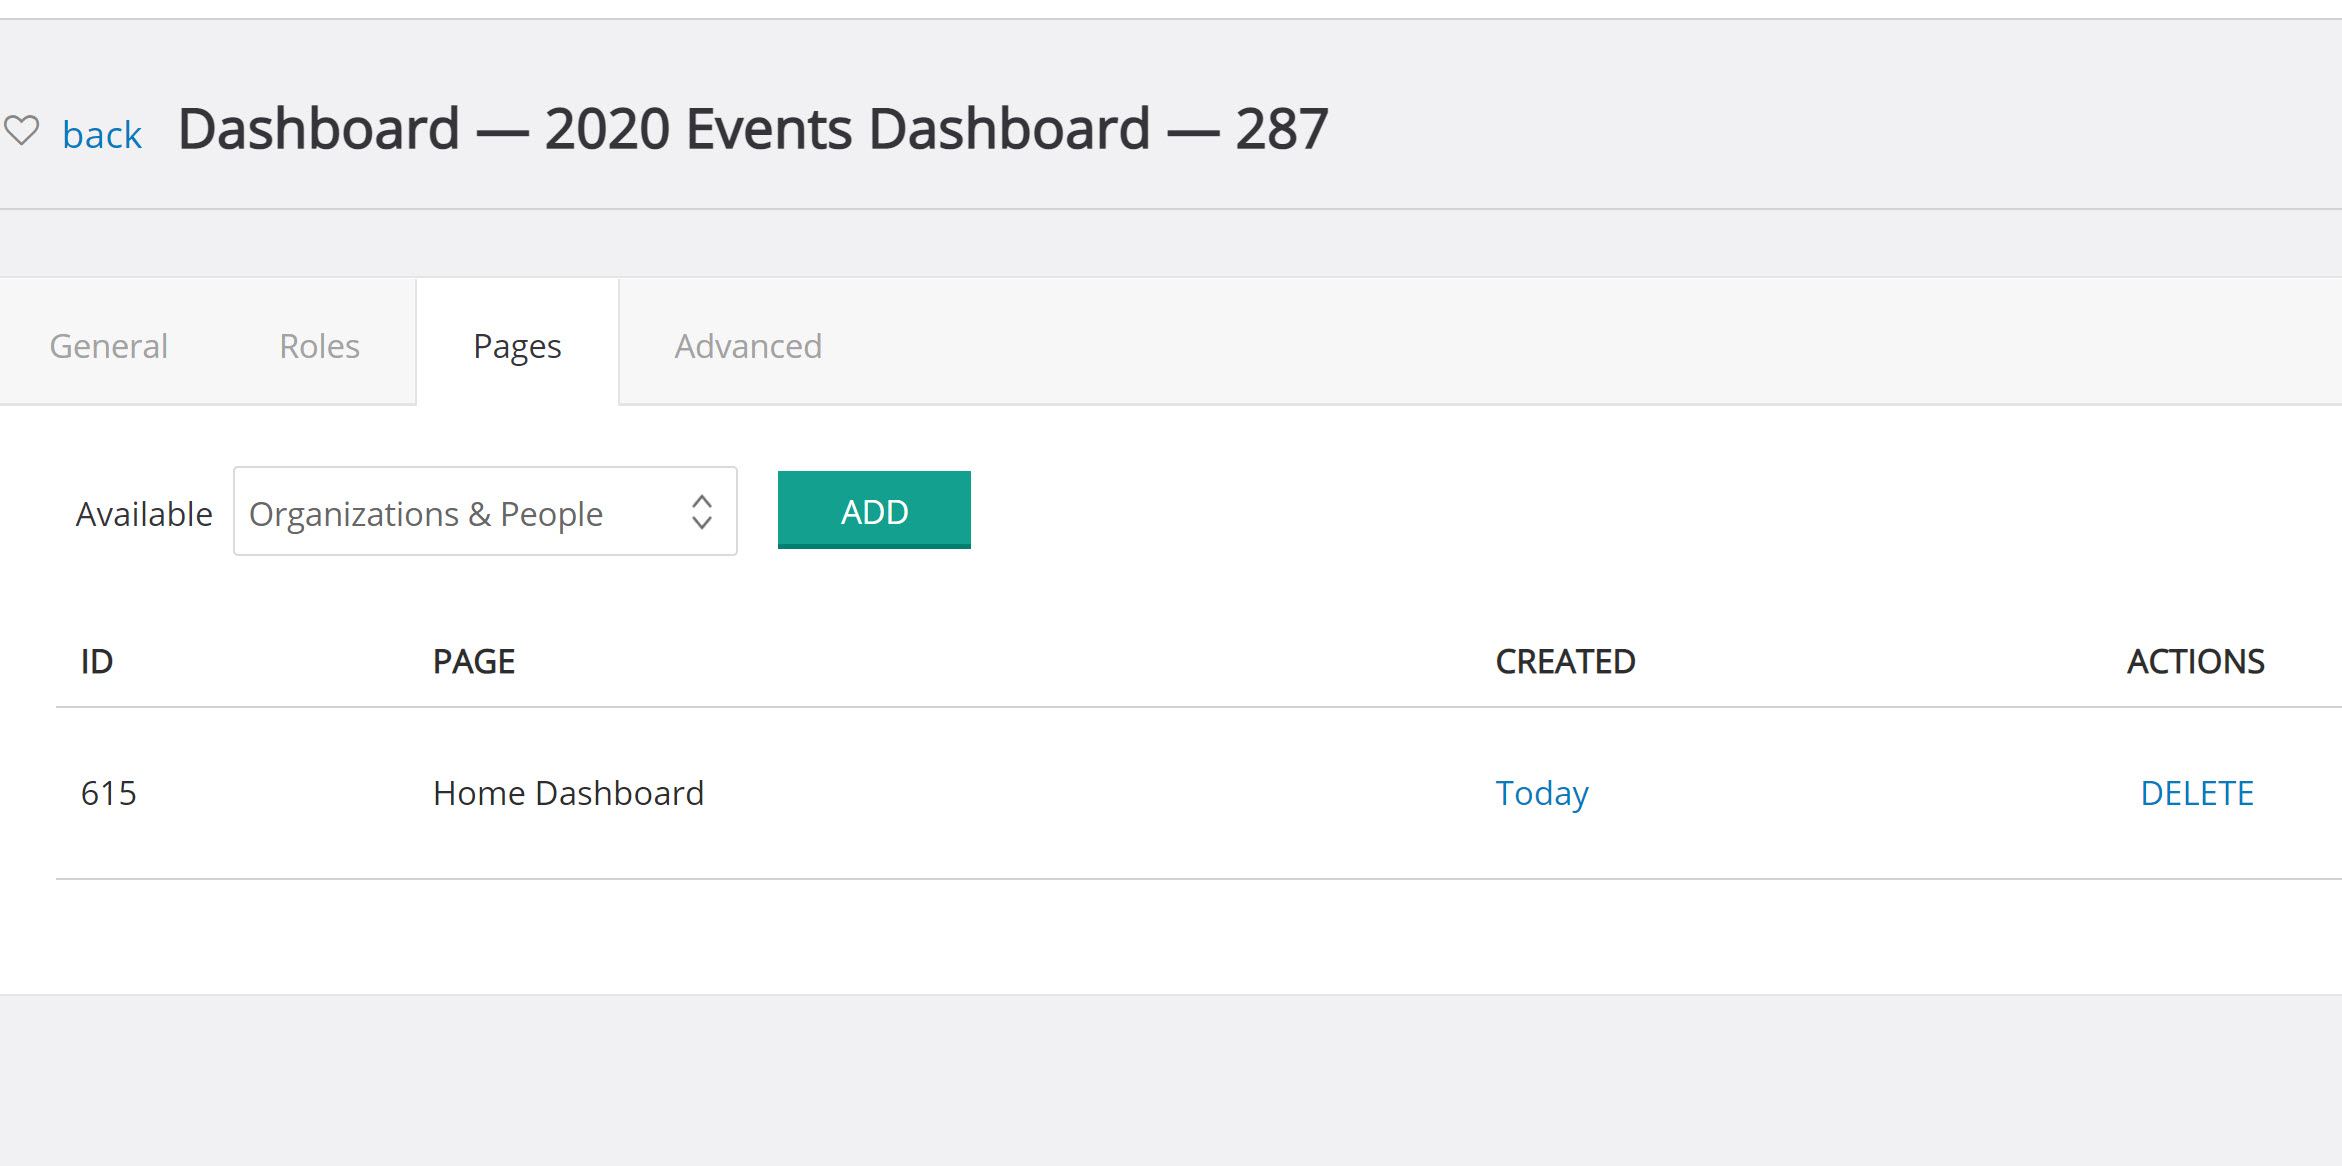
Step 6: Navigate to the Advanced tab for access to advanced developer tools.
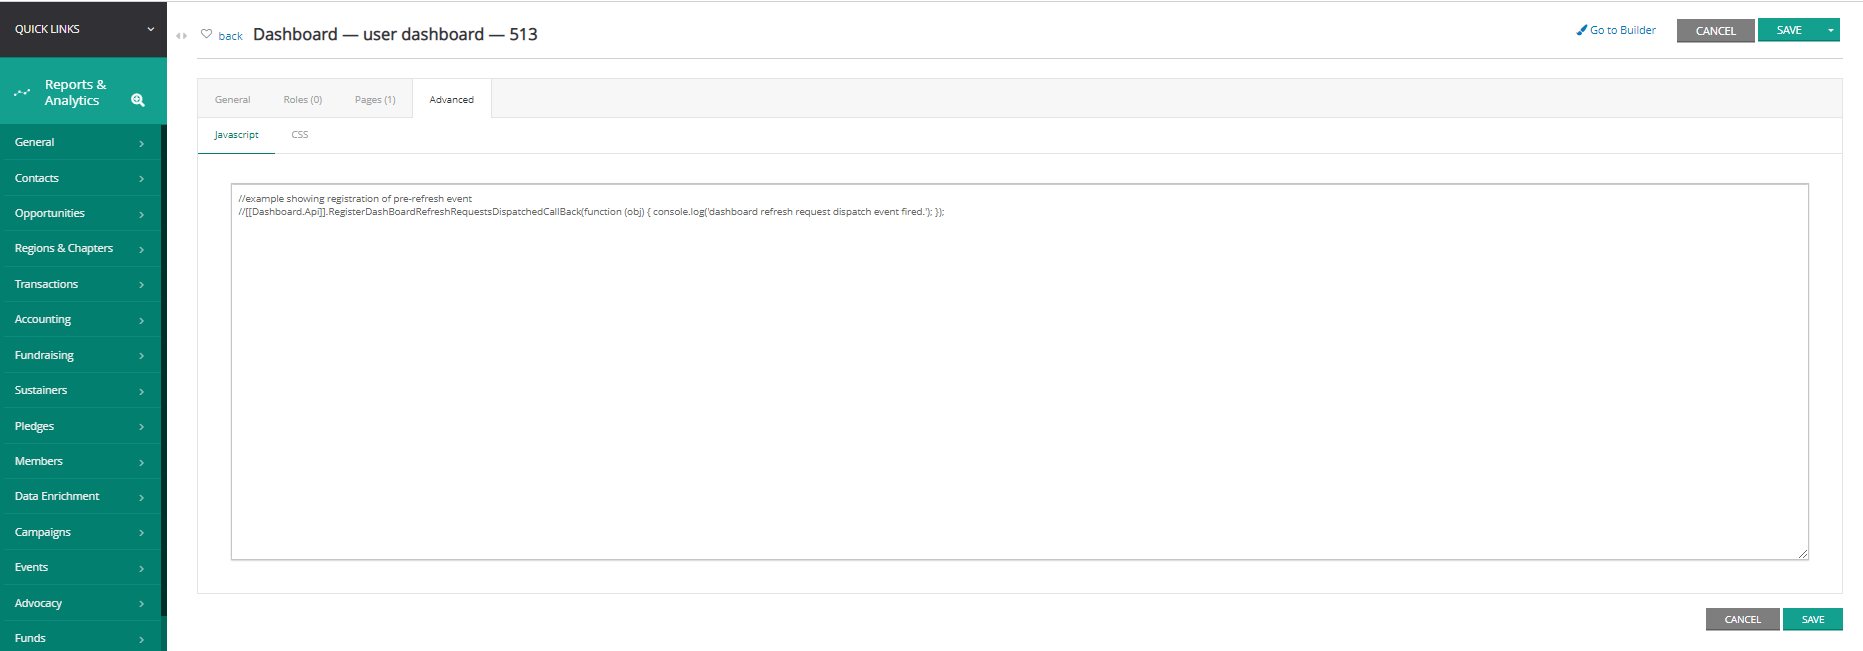
Step 7: Click SAVE to secure your changes.
Instructions: Editing the Dashboard
Once the dashboard has been configured, you can begin to build and or edit your dashboard.
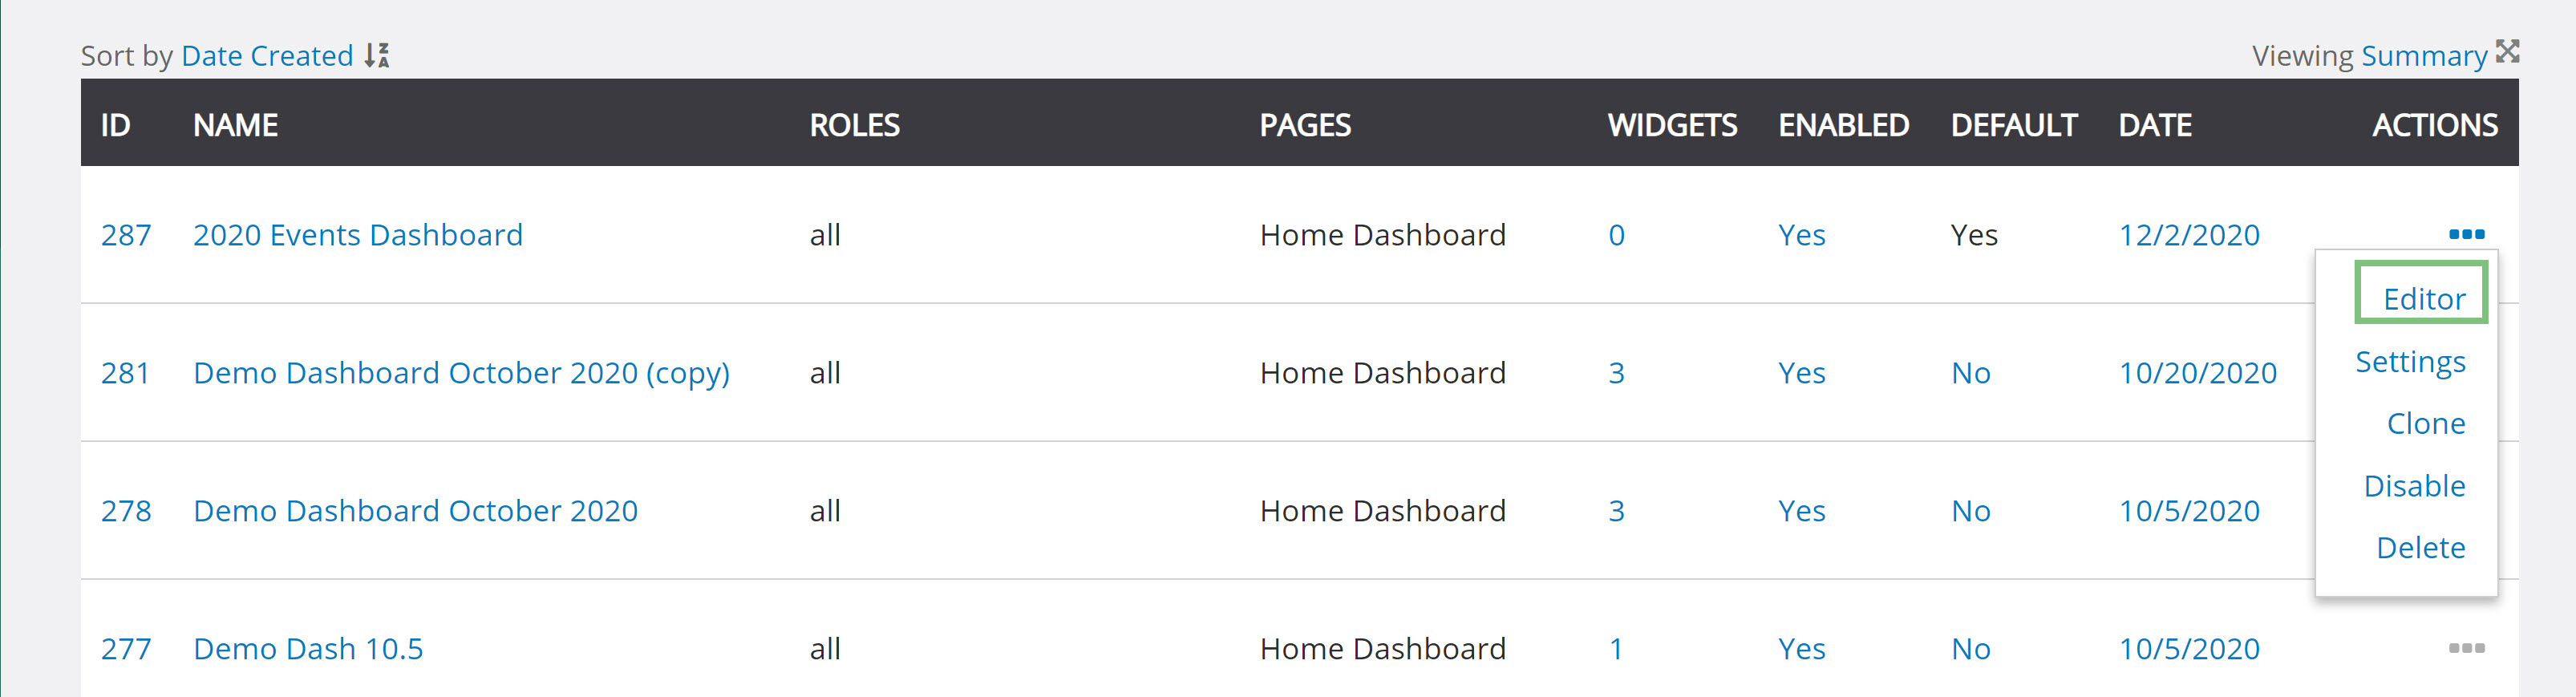
Step 1: If you have completed your configuration from the above steps, navigate to SAVE > drop down arrow > Editor or click on Go to Builder link
Note: if you are accessing the listing screen, navigate to the Reports & Analytics App > General > Dashboard > locate your dashboard > ACTIONS > Editor
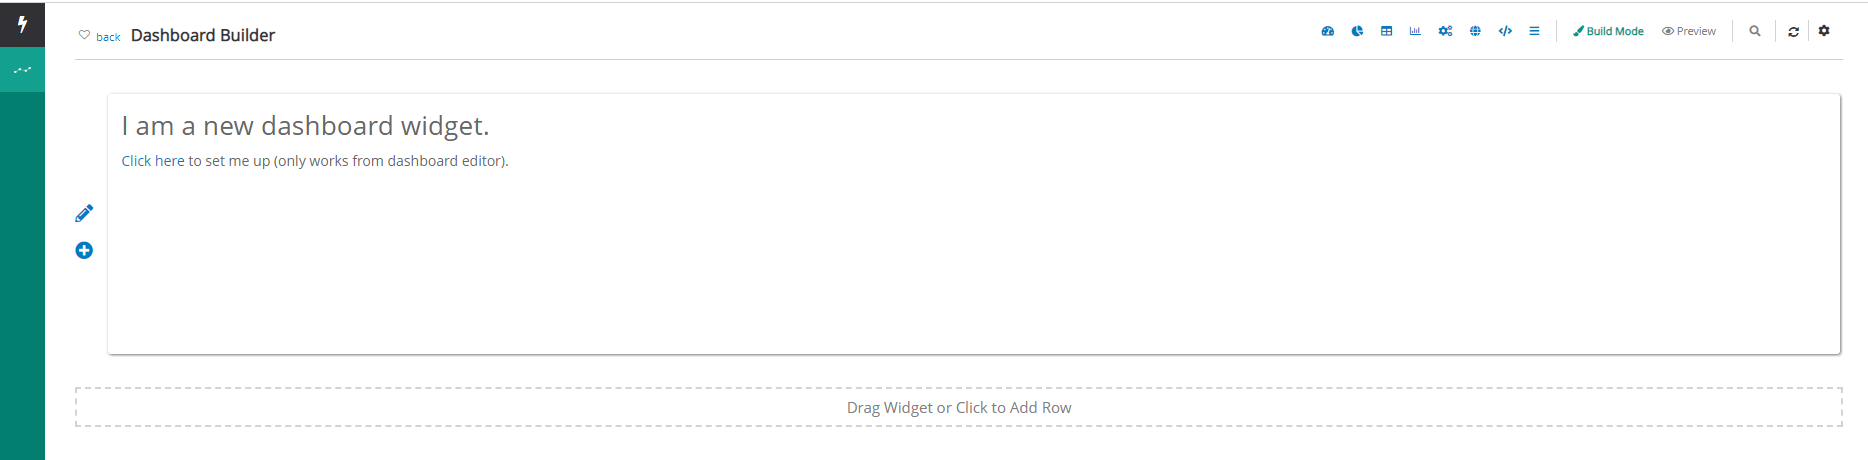
Step 2: The dashboard will be initiated with one row to begin your design.
Instructions: Managing Rows & Panels
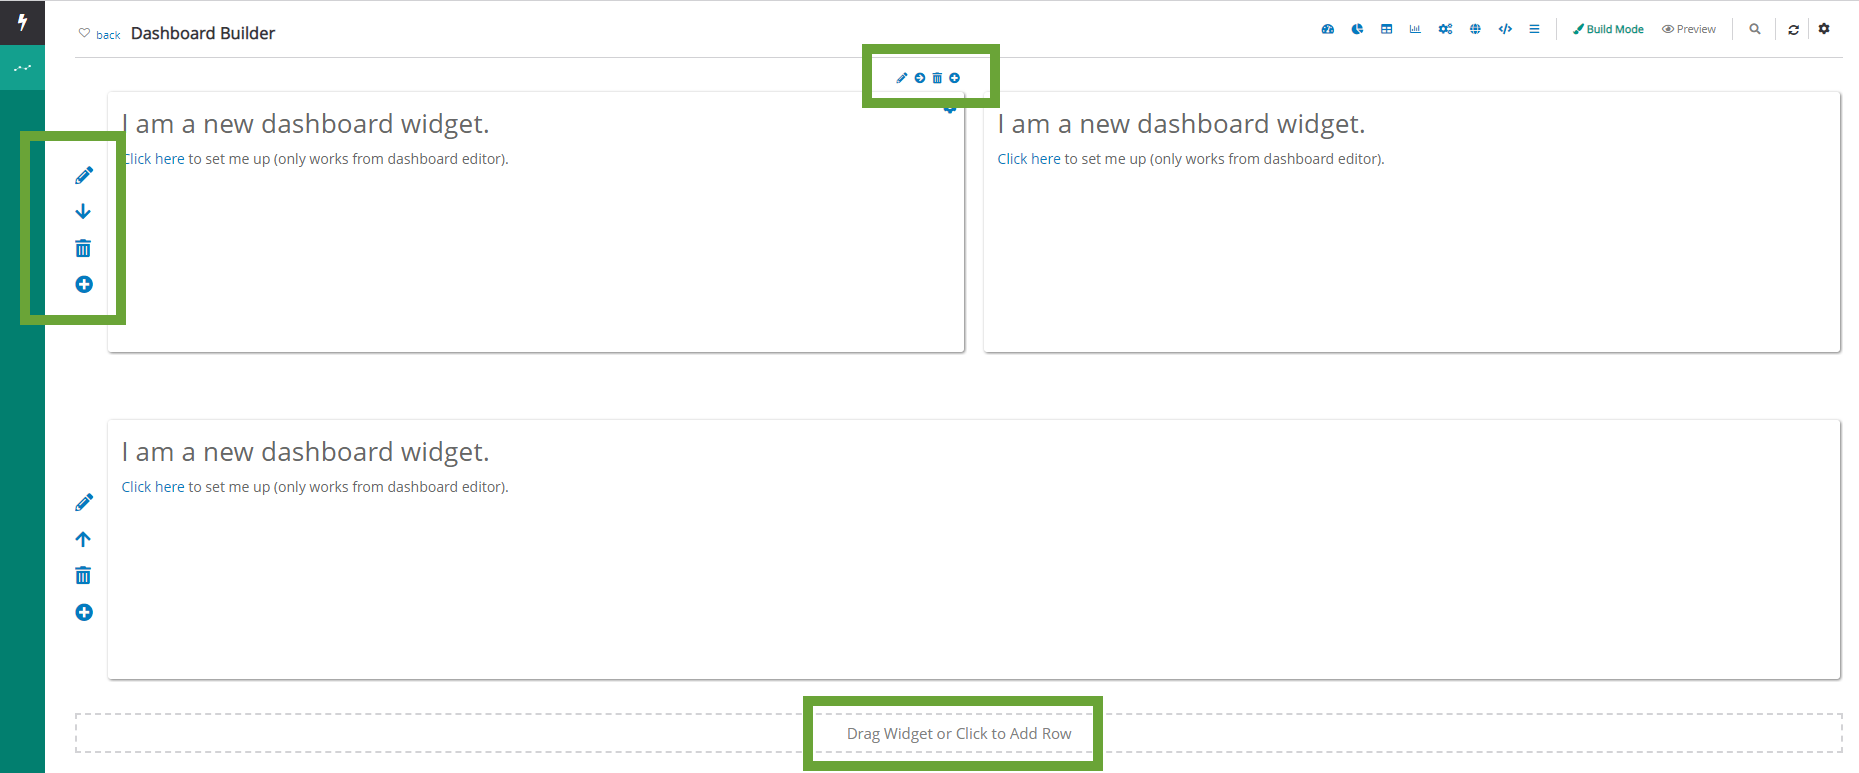
Once the dashboard has been configured, you can begin to build and or edit your dashboard. The Dashboard feature allows the user to add, delete, reorder rows and panels.
- Add rows by Drag Widget or Click to Add Row
- Within a row, add panels by clicking the plus icon
- Use the Up and Down arrow to move row positions
- Use the Left and Right arrow to move panels
- Use the Trashcan icon to delete a row
- Use the Pencil icon to create a row label or panel label
Instructions: Creating a New Dashboard Widget
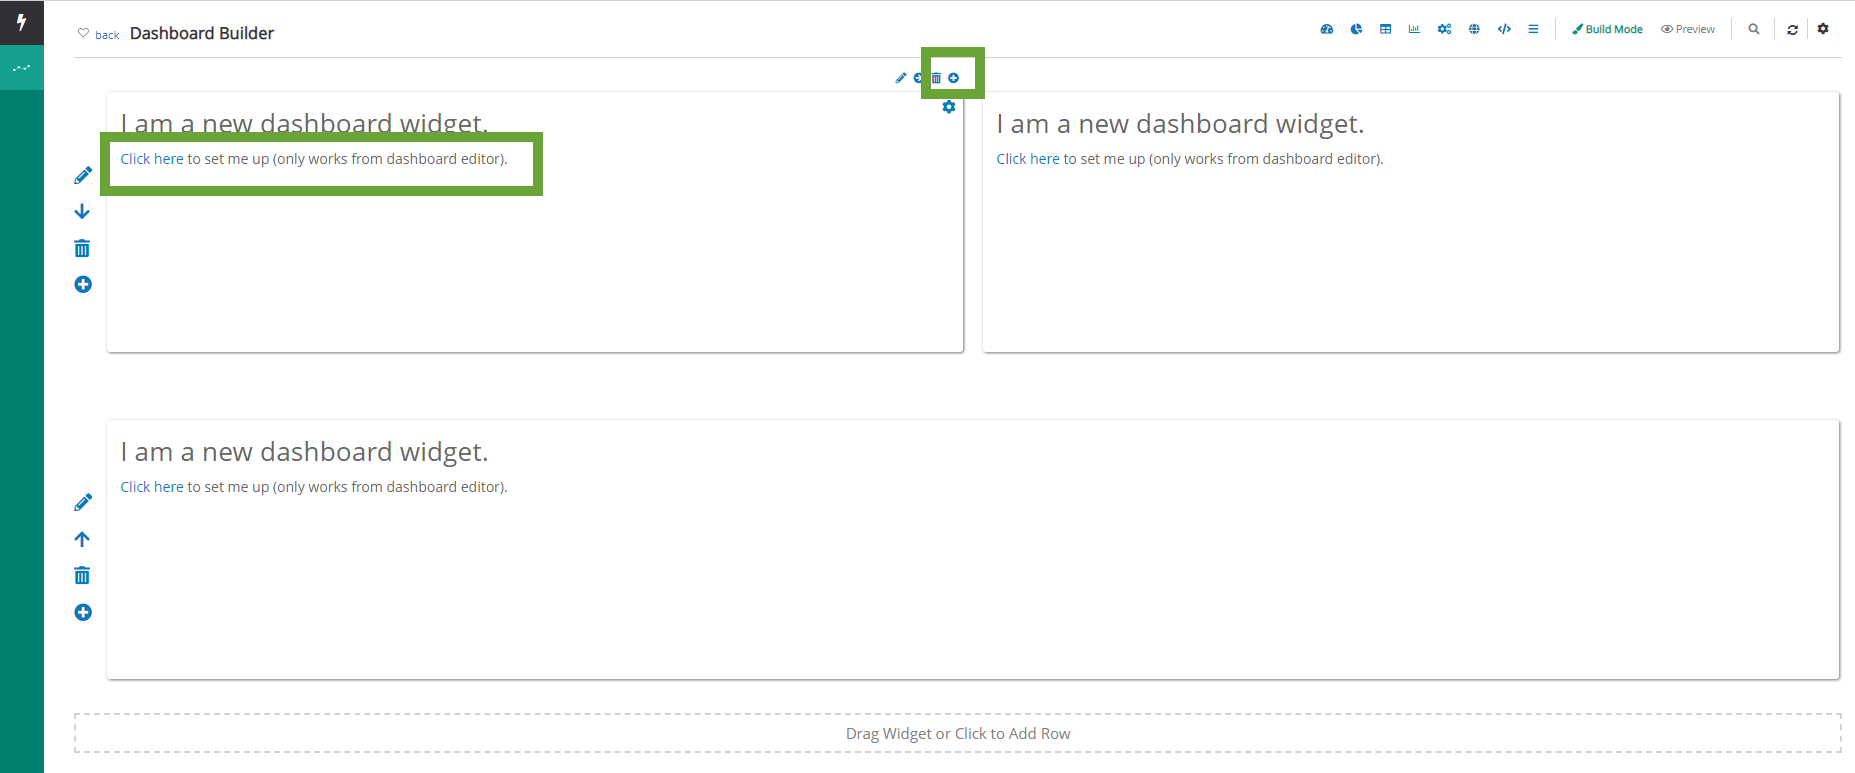
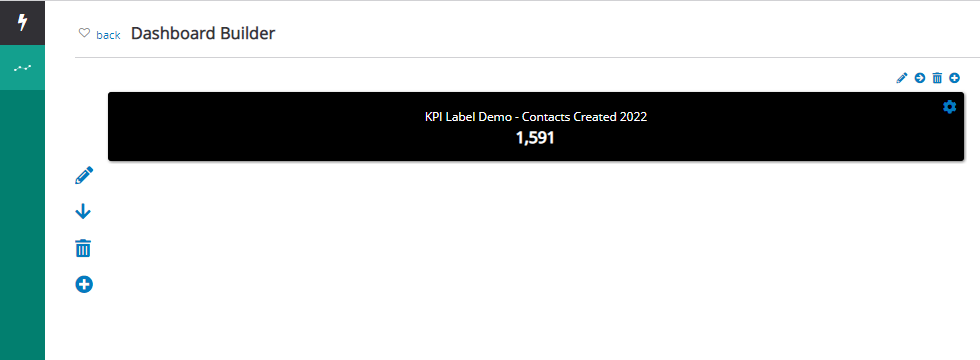
Once a row has been created, begin to add dashboard widgets by clicking on Click here to set me up within the panel. Or within a panel click on the Plus icon to add a widget.
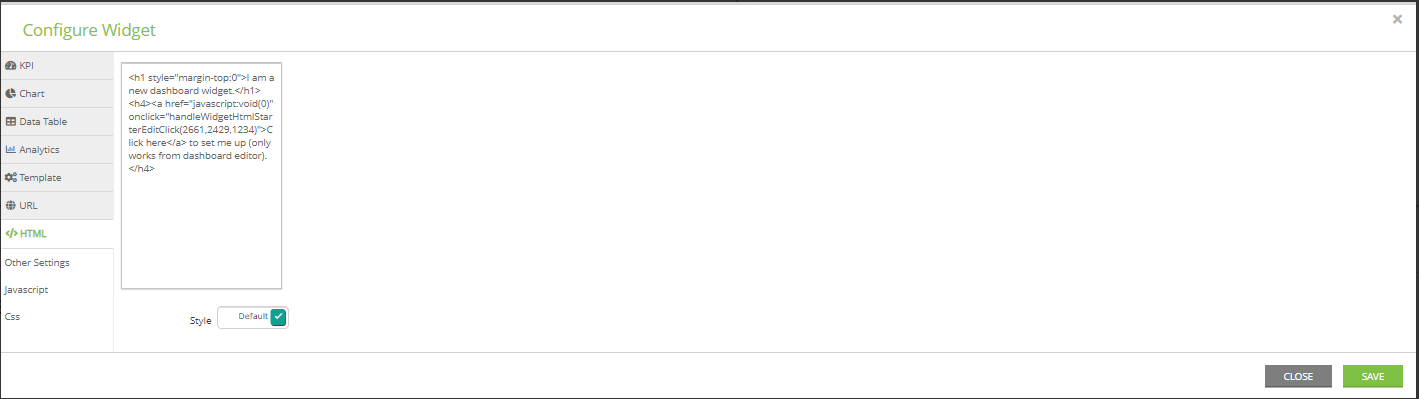
Overview: Dashboard Widgets
This section provides an overview of the configurable widgets available to include within a dashboard.
KPI Widget
-
- Label: Header for widget
- Color: widget background color
- Format: of value
- Data Set 1: use the Pencil icon to select your data source
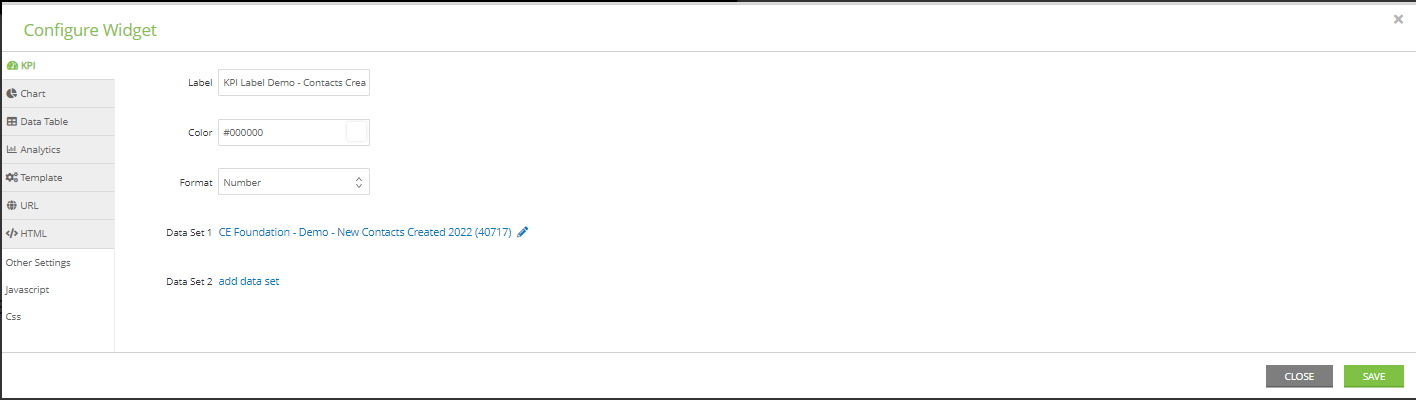
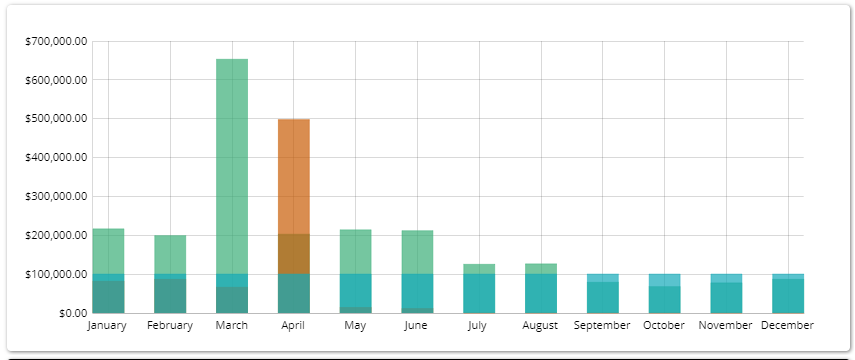
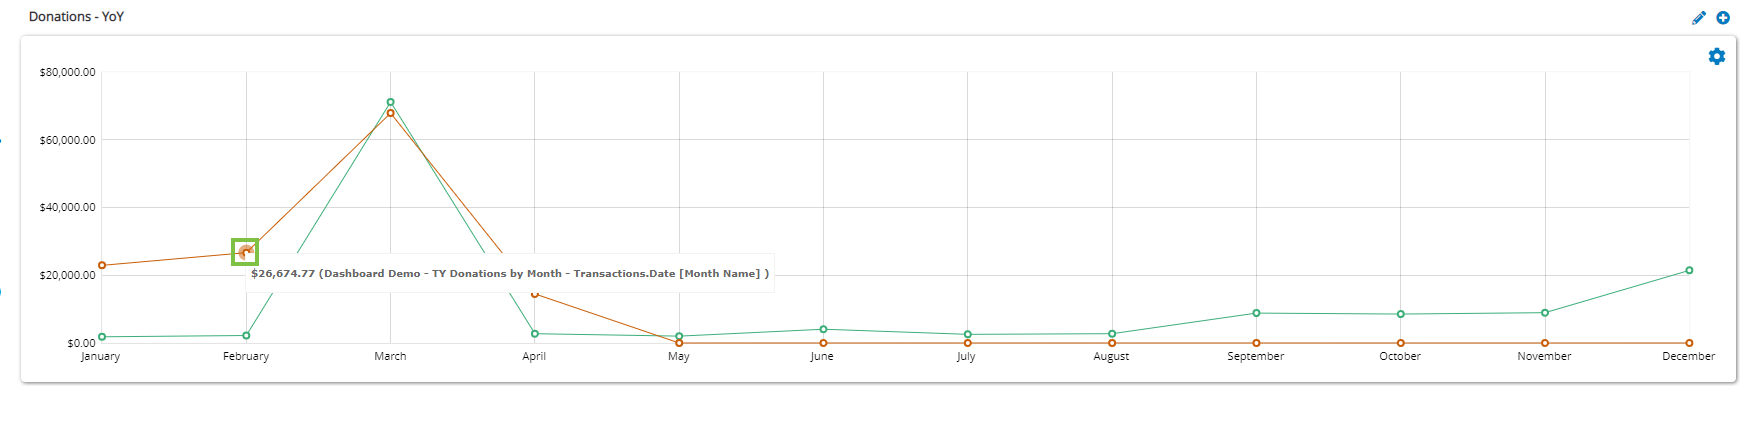
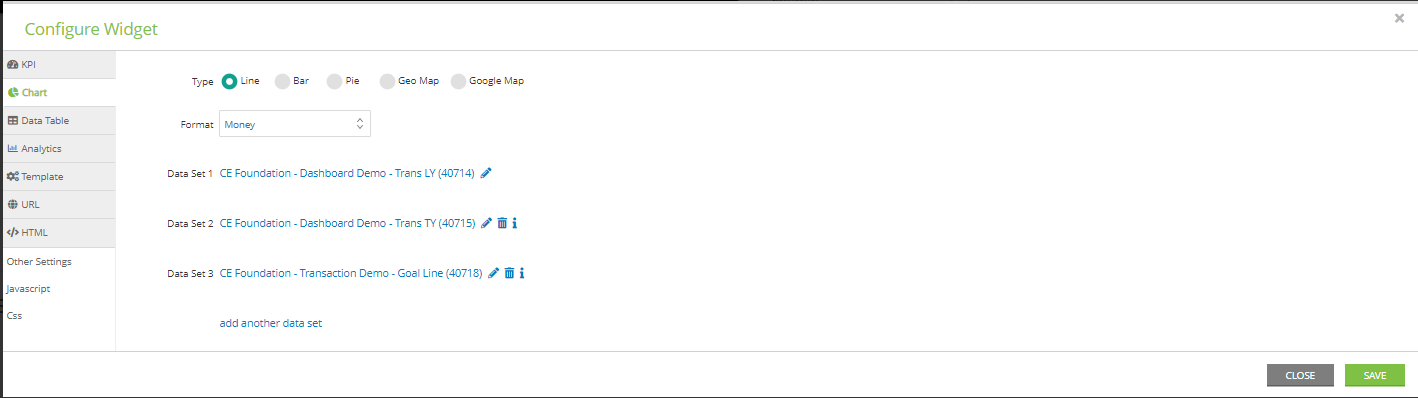
Chart Widget
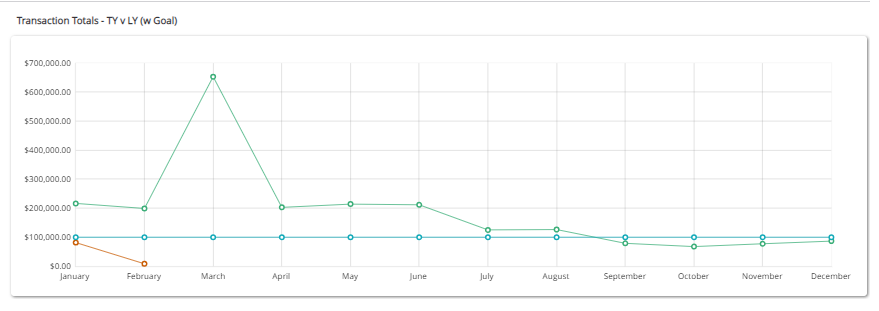
Leverage the graph legends by hovering over each dot within the chart to view the details for the specific data point.
-
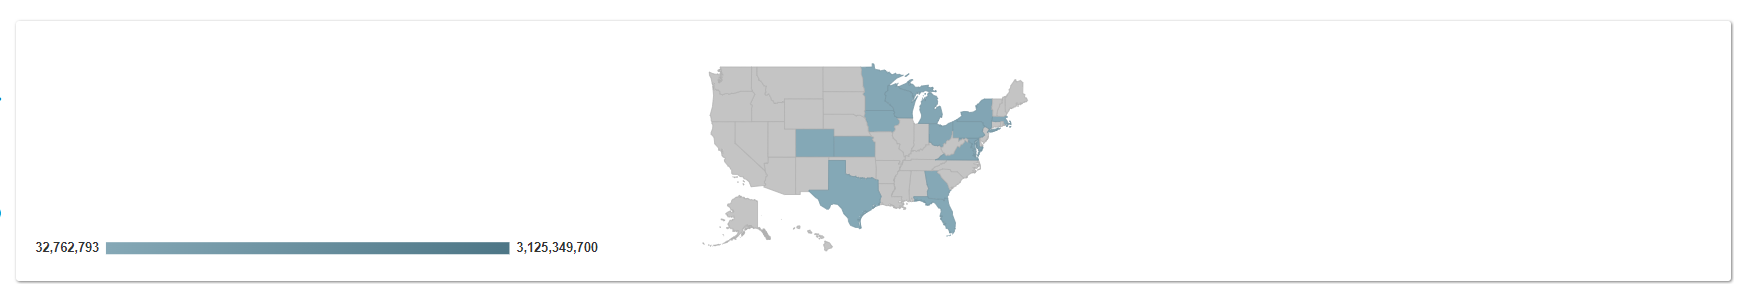
- Type: select from available options
- Note: Use of Geo Map and Google Map for map integration requires setup of the organization's Google Map API Key. Learn more here on how to set up the API integration.
-
-
Format: adjust default if needed
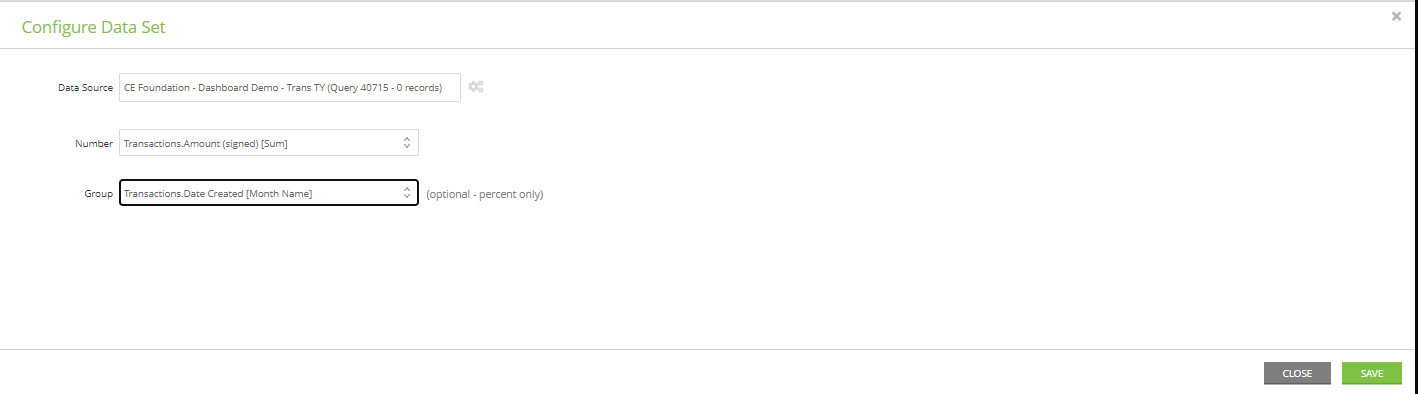
- Data Set 1: use the Pencil icon to select your data source - add additional data sets as needed
- Note: Use of Geo Map and Google Map for map integration requires setup of the organization's Google Map API Key. Learn more here on how to set up the API integration.
- Type: select from available options
-
-
- In this data set example, the y-axis will represent the total transaction sum (Transactions.Amount (signed) [Sum] from the query). The x-axis represents the transaction month (Transactions.Date Created [Month Name]). Note, in the query, the Month Name is achieved by configuring the sort within the query.
-
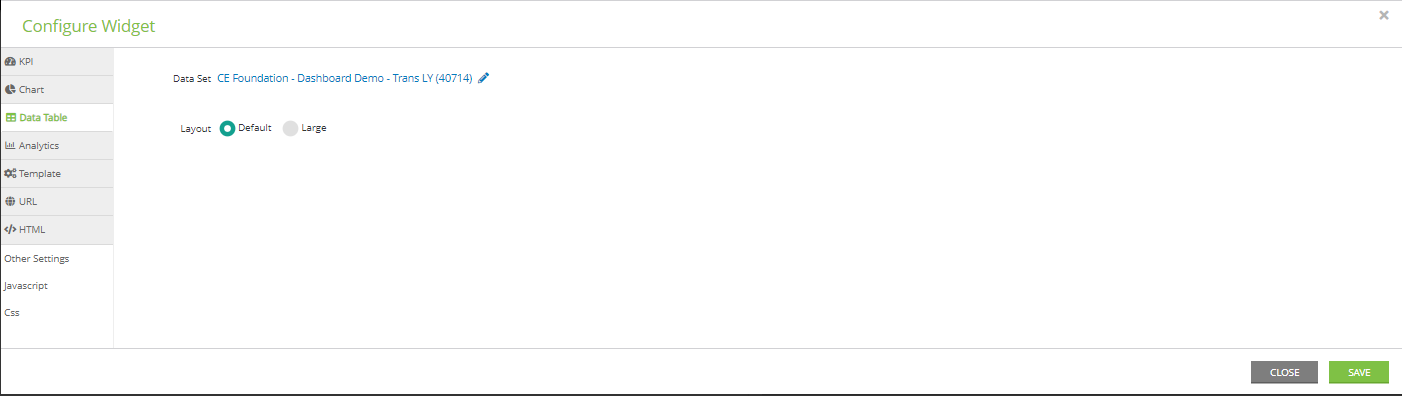
Data Table Widget
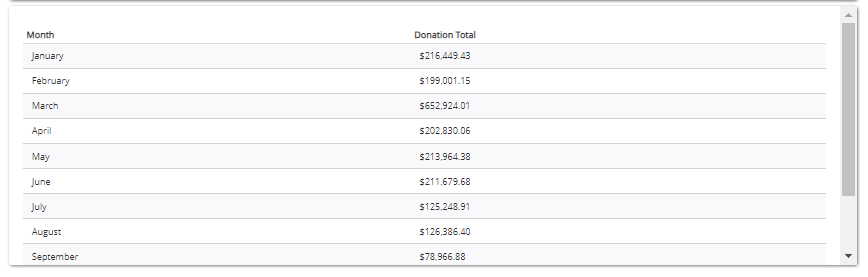
-
- Data Set: Use the Pencil icon to select your data set
- Layout: select default or large
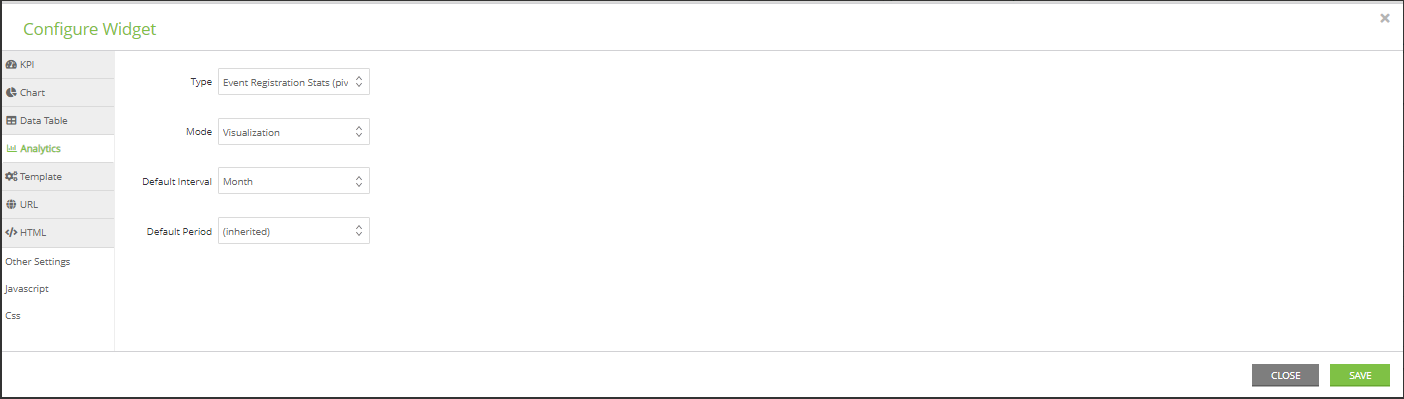
Analytics Widget
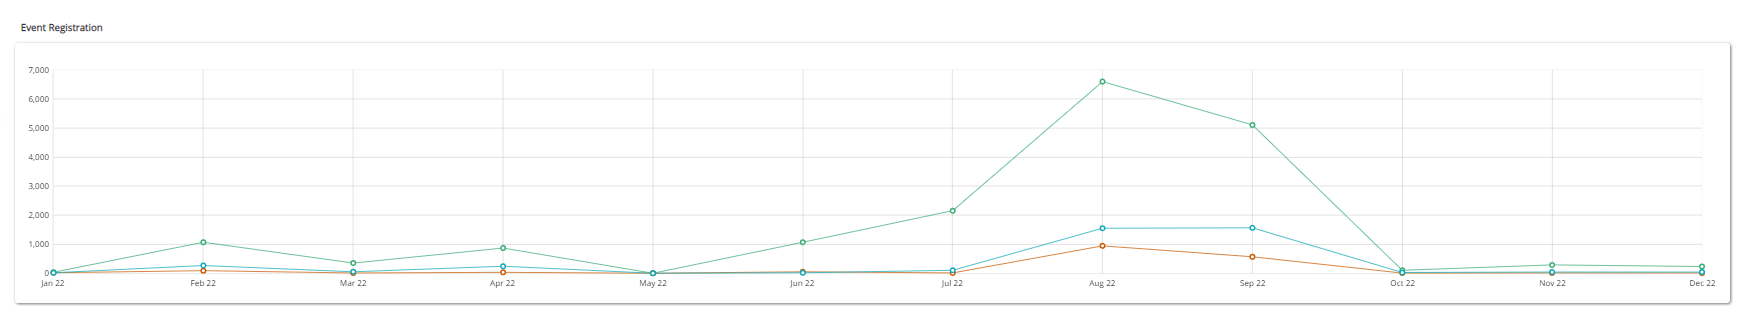
-
- Type: From the drop down, select from a list of out-of-the-box analytics
- Mode: select visualization or data set (where available)
- Default Interval: select from available frequency
- Default Period: select from available time periods
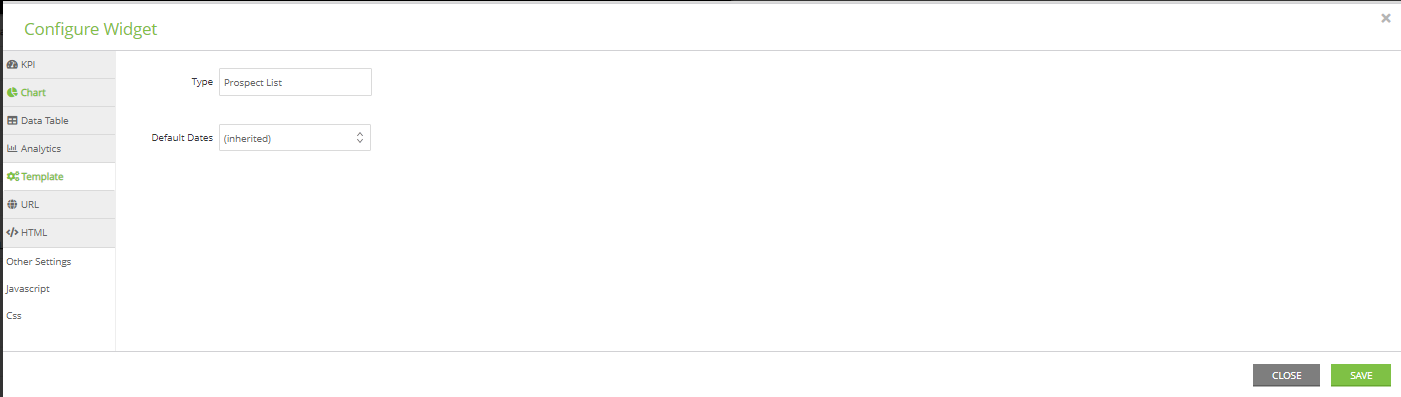
Template Widget
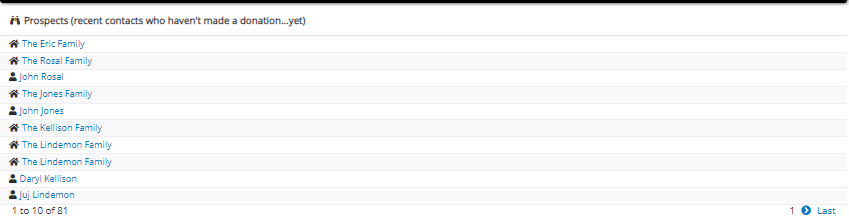
-
- Type: From the drop down, select from a list of out-of-the-box dashboard analytics widgets
- Default Dates: select from available time periods
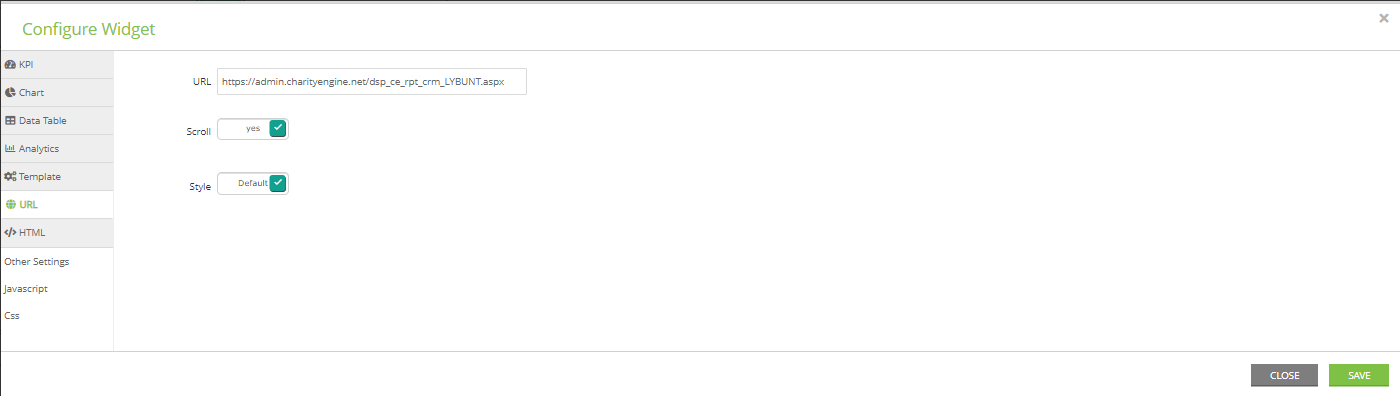
URL Widget
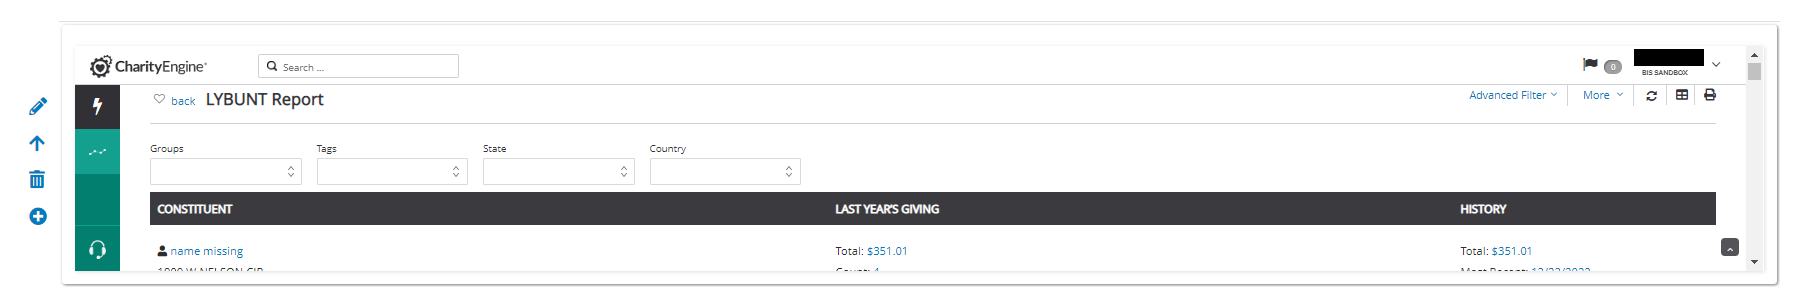
-
- URL: add url
- Scroll: toggle to yes as needed
- Style: toggle to none as needed
Other Configuration Widgets
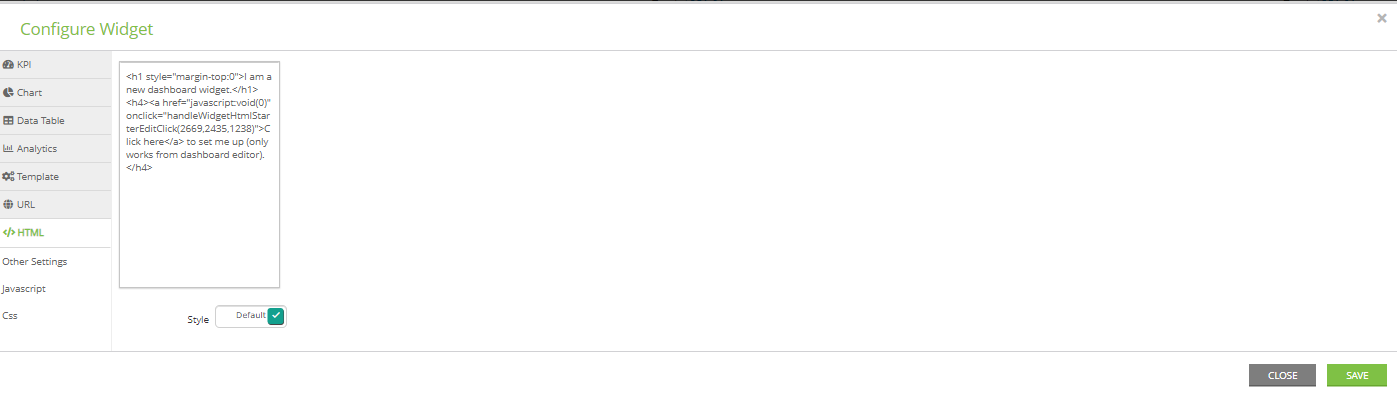
-
- HTML: leverage for custom development
- Other Settings: Add dashboard title for row
- Javascript: leverage for custom development
- Css: leverage for custom development
Duplicating Dashboard
When creating a dashboard, you may want to use a dashboard that has already been created, however change a few small things. Instead of creating a whole new dashboard, you can duplicate an existing dashboard and then make the changes to the reports displayed.
Step 1: Navigate to Reports & Analytics > General > Dashboard > locate your dashboard > ACTIONS > Clone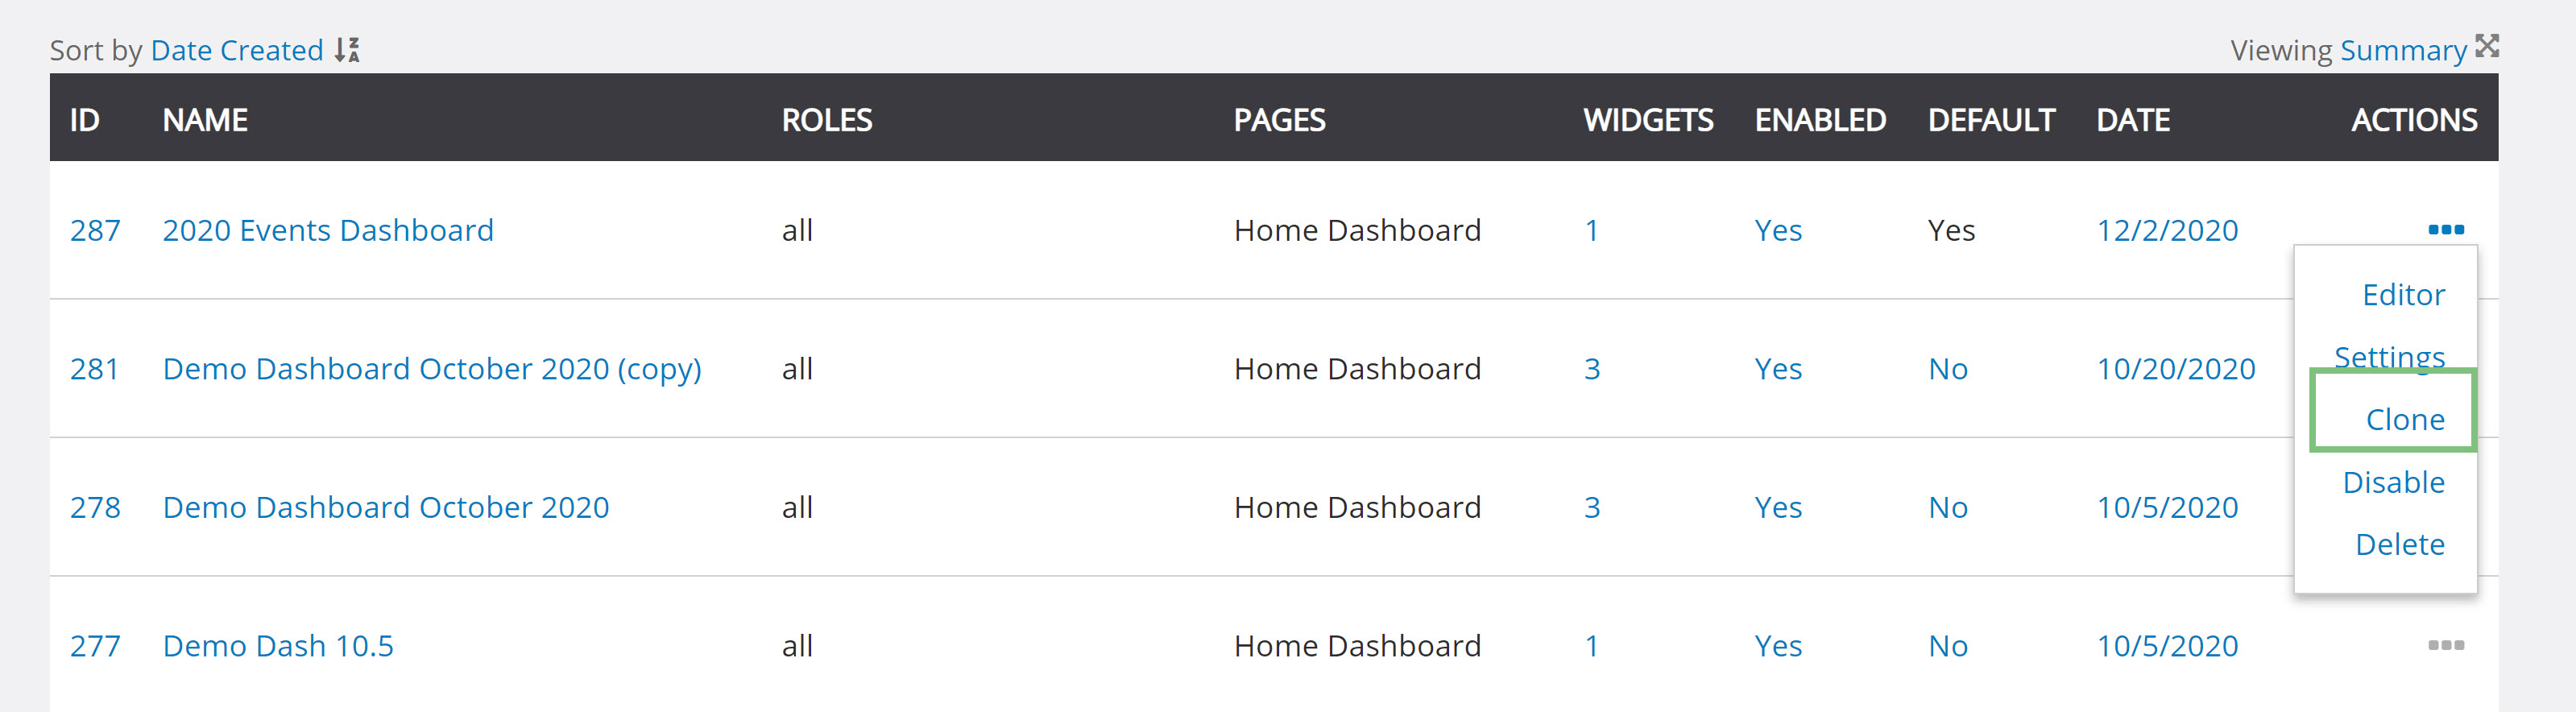
Returning to a Dashboard
To return to the home page from any location, click on the CharityEngine® logo found in the top left corner of the screen. To change the dashboard, click on the Gear and select your <Organization Name> Dashboard.
FAQs & Additional Reading
Q. I'd like to learn more about CharityEngine reporting options.
A. Learn about our various reporting capabilities by visiting Reports & Analytics: An introduction to reporting within CharityEngine
Q. Why are my giving totals not populating on my main dashboard? Why don't we have a Goal set?
A. Values for gift history is driven by the presence of an organizational goal. This value can be set by accessing the Configuration App > General > Goals > Current Period

Q.How are the values determined in the out of box dashboard used for the main dashboard?
A. Values are updated hourly in the top portion of the main dashboard. Donations totals related to total in online gifts vs. total in gifts from other changes are allocated based upon Media Channel and Response Channel configuration. If you would like to review current settings or modify, please navigate to the Configuration App > Campaign > Media Channels (and Response Channels) > ACTIONS > Manage > Type: Traditional or Online. Note, changes take 24 hours to reflect on changes from the dashboard.